Charting a successful technical test, S&P 500 nails major support
Focus: Oil services sector takes flight, Amazon and Apple challenge 200-day average, OIH, AMZN, AAPL, MRNA, ESTC
U.S. stocks are higher early Friday, rising after a market-friendly monthly jobs report, signaling a still strengthening economy in the absence of overheated conditions.
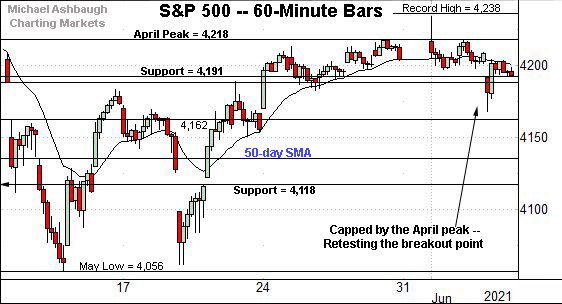
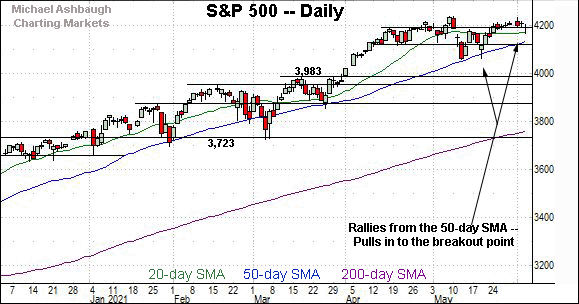
Against this backdrop, the S&P 500 has maintained major support (4,191), rising early Friday within striking distance of record highs.
Editor’s Note: As always, updates can be directly accessed at chartingmarkets.substack.com.
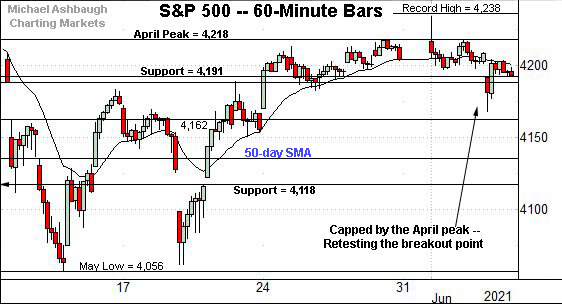
Before detailing the U.S. markets’ wider view, the S&P 500’s hourly chart highlights the past four weeks.
As illustrated, the S&P has maintained its breakout point (4,191).
Thursday’s close (4,192) registered nearby.
More immediately, the latest retest of the April peak (4,218) is underway with Friday’s strong start.
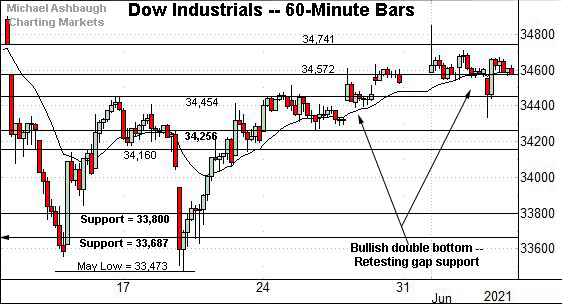
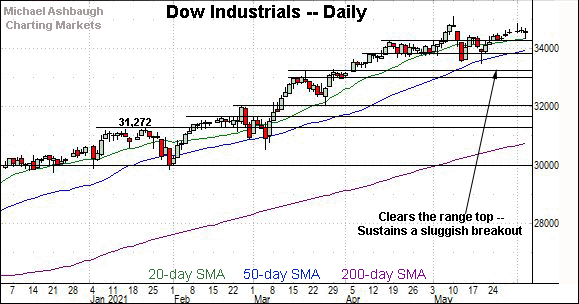
Meanwhile, the Dow Jones Industrial Average has sustained its recent breakout amid a flattish June start.
In its case, Thursday’s close (34,577) roughly matched familiar gap support (34,572).
Delving slightly deeper, the Dow’s breakout point (34,454) has effectively underpinned the early-June price action.
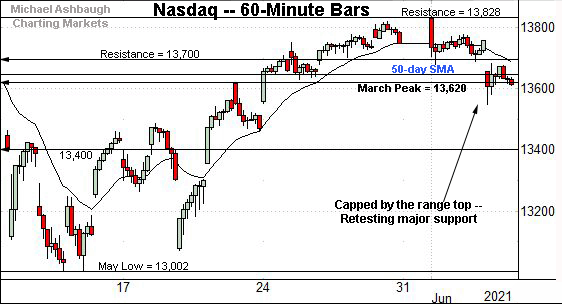
Against this backdrop, the Nasdaq Composite has balked at familiar resistance.
Recall the June peak (13,836) has roughly matched the Nasdaq’s one-month range top (13,828), detailed previously.
More immediately, the Nasdaq seems to have weathered a shaky retest of the March peak (13,620).
Thursday’s close (13,614) registered nearby, and the Nasdaq is firmly higher early Friday.
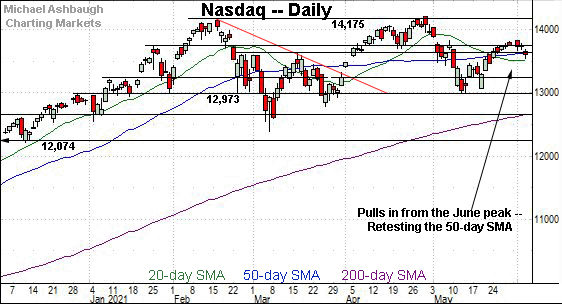
Widening the view to six months adds perspective.
On this wider view, the Nasdaq is vying to sustain a grinding-higher rally from the March low.
Tactically, the 50-day moving average, currently 13,653, and the March peak (13,620) remain bull-bear inflection points.
Conversely, overhead inflection points match the early-May gap (13,795) and the slightly more distant range top (13,828).
Beyond the details, the Nasdaq’s intermediate-term bias remains bullish-leaning based on today’s backdrop. An eventual violation of the March peak (13,620) would raise a question mark.
Looking elsewhere, the Dow industrials’ backdrop remains bullish, and comparably straightforward.
Tactically, the breakout point (34,454) and the April peak (34,256) mark downside inflection points. (See the hourly chart.)
Conversely, the Dow’s record close (34,777.76) and absolute record peak (35,091.56) remain within striking distance.
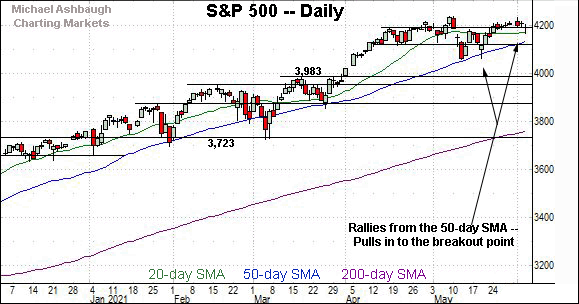
Meanwhile, the S&P 500 has narrowly sustained a modest late-May breakout.
To reiterate, Thursday’s close (4,192) closely matched the breakout point (4,191). Friday’s early upturn punctuates a successful retest.
The bigger picture
Collectively, the U.S. benchmarks’ bigger-picture backdrop remains bullish — (or at least bullish-leaning, in the Nasdaq’s case) — amid a generally sluggish June start.
Each big three U.S. benchmark has sustained its late-May breakout, maintaining a posture atop familiar support.
(Specific levels include S&P 4,191 and Nasdaq 13,620, areas that remain in play on the hourly charts.)
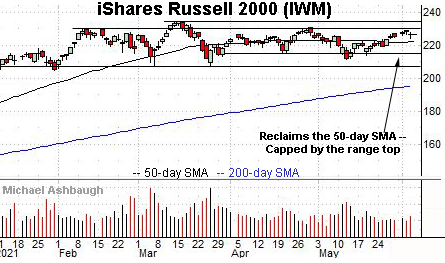
Moving to the small-caps, the iShares Russell 2000 ETF remains range-bound.
Familiar overhead spans from 230.30 to 230.95, levels matching the February and April peaks.
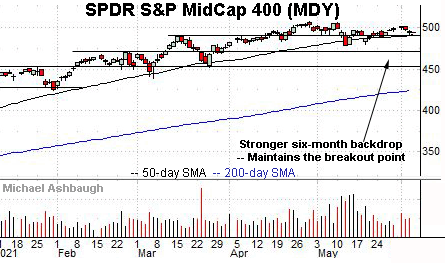
True to recent form, the SPDR S&P MidCap 400 remains comparably stronger.
The mid-cap benchmark has sustained a posture atop its 50-day moving average, currently 491.40, and the former breakout point (489.50).
Placing a finer point on the S&P 500, the index has sustained its break from a double bottom — the W formation — defined by the May lows.
Tactically, familiar support holds in the 4,188-to-4,191 area.
Thursday’s close (4,192) effectively matched support.
Conversely, the April peak (4,218) has marked an overhead sticking point.
Returning to the six-month view, the S&P 500’s recent flatlining price action punctuates consecutive May retests of the 50-day moving average.
On further strength, the S&P’s record close (4,232.60) and absolute record peak (4,238.04) remain within view.
More broadly, a near- to intermediate-term target projects from the S&P’s mini double bottom to the 4,310 area, detailed previously.
Beyond the details, the S&P 500’s intermediate-term bias remains bullish, based on today’s backdrop. The weekly close may add color.
Watch List
Drilling down further, consider the following sectors and individual names:
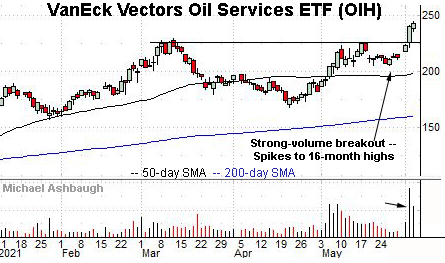
To start, the VanEck Vectors Oil Services ETF has broken out.
The upturn punctuates a cup-and-handle — defined by the April and late-May lows — placing the group at 16-month highs.
Though near-term extended, and due to consolidate, the strong-volume spike is longer-term bullish. The breakout point, circa 226.50, pivots to support.
Slightly more broadly, notice the early-May strong-volume rally — subsequent lighter-volume pullback — and decisive June follow-through. Bullish price action.
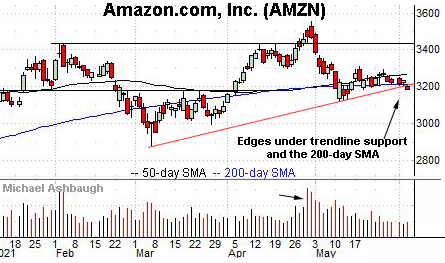
Moving to specific names, Amazon.com, Inc. is tenuously positioned.
Technically, the shares have edged under trendline support and the 200-day moving average, currently 3,225.60. The downturn raises the flag to a potential primary trend shift.
Delving deeper, the March range top (3,182.00) is followed by the May low (3,127.40). An eventual violation would mark a “lower low” confirming the bearish trend shift.
Tactically, a swift reversal atop the 50-day moving average — and the mid-May range top (3,312.00) — would place the shares on firmer technical ground.
Slightly more broadly, notice the strong-volume early-May downdraft and subsequent sluggish rally attempt. Shaky price action.
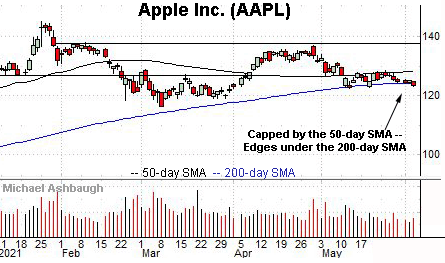
Similarly, Dow 30 component Apple, Inc. — most recently profiled Wednesday — remains tenuously positioned.
Consider that Thursday’s close registered fractionally under the 200-day moving average, currently 124.32, for just the second time since April 2020.
The prevailing downturn marks the third recent test of the 200-day in as many weeks. Major support is frequently violated on the third or fourth independent test.
Tactically, deeper floors match the May range bottom (122.25) and the March low (116.20).
Conversely, overhead inflection points match the October peak (125.40) and the 50-day moving average, currently 128.14. Follow-through atop this area would place the shares on firmer technical ground.
Also recall that Apple’s tight three-week range — defined by the 50- and 200-day moving averages — lays the groundwork for a potentially sharp move in either direction.
Against the current backdrop, a violation of the May range bottom (122.25) marks a “watch out.”
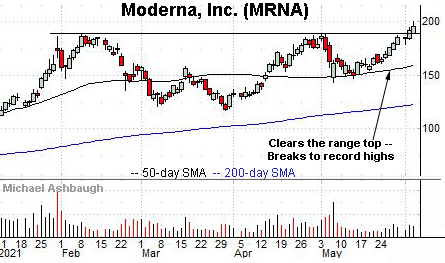
Moderna, Inc. is a well positioned large-cap biotech name.
As illustrated, the shares have edged to record highs, rising after the company signaled it has begun the process for seeking full regulatory approval of its Covid vaccine. (The current vaccines are approved for emergency use.)
The prevailing upturn punctuates a well-defined cup-and-handle. An intermediate-term target projects to the 230 area.
Conversely, the breakout point, circa 189, pivots to support. A sustained posture higher signals a bullish bias.
Delving deeper, the June breakout originates from the 50-day moving average.
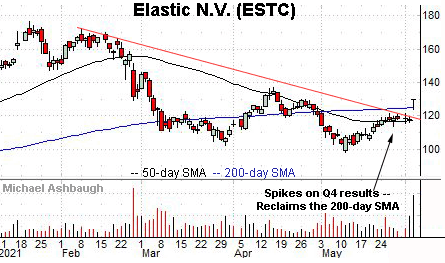
Finally, Elastic N.V. is a large-cap developer of open source search and analytic engine services.
Technically, the shares have knifed atop trendline resistance, rising after the company’s smaller-than-expected quarterly loss. The strong-volume spike signals a trend shift.
Tactically, the 200-day moving average, currently 124.90, is closely followed by gap support (123.75). The prevailing rally attempt is intact barring a violation.
More broadly, notice the developing double bottom, defined by the March and May lows.


