Nasdaq nails first resistance (again) as VIX signals stubborn complacency
Focus: Charting key levels to track amid U.S. sector damage, VIX continues to signal relative complacency, XLF, TRAN, IYR, XLP, XME
Technically speaking, the major U.S. benchmarks continue to trend lower, pressured as inflation concerns persist amid a disappointing batch of corporate earnings reports.
Against this backdrop, the S&P 500 is pacing a seven-week losing streak — its longest since 2001 — while the Dow Jones Industrial Average is pacing an eight-week losing streak, its longest stretch since 1923. Though due a corrective bounce, the bigger-picture trends remain firmly-bearish.
Editor’s Note: As always, updates can be directly accessed at https://chartingmarkets.substack.com.
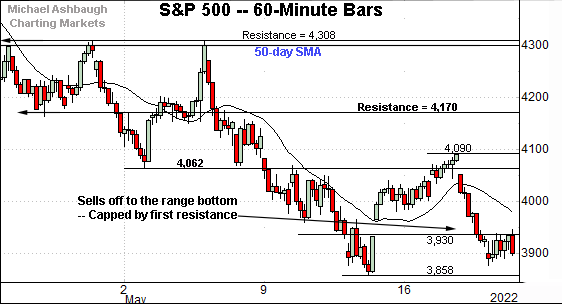
Before detailing the U.S. markets’ wider view, the S&P 500’s hourly chart highlights the past four weeks.
As illustrated, the S&P is holding its range bottom.
The late-week rally attempt has been flat, and effectively capped by first resistance (3,930).
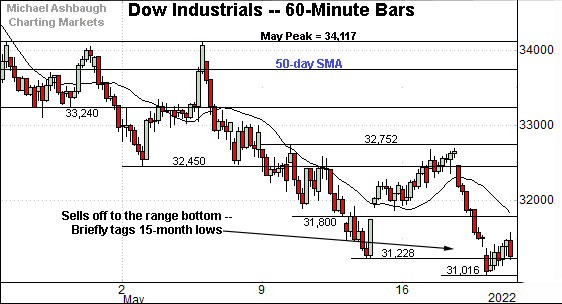
Meanwhile, the Dow Jones Industrial Average has registered new lows.
Amid the downturn, recall the 20-hour moving average has marked an inflection point.
Wednesday’s violation preceded aggressive downside follow-through, amid a steep 1,165-point single-day loss. The Dow’s biggest single-day plunge since June 2020.
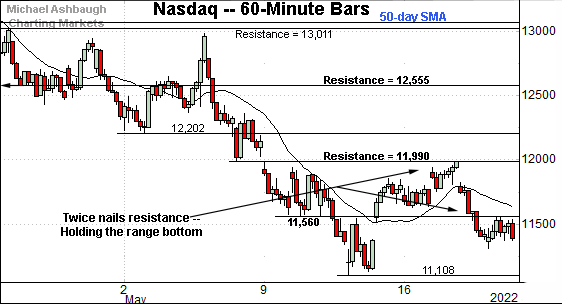
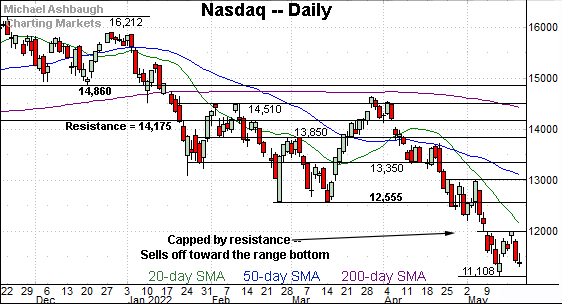
Against this backdrop, the Nasdaq Composite has staged consecutive failed technical tests.
As detailed previously, the 11,560 area marks an inflection point. (See Wednesday’s review.)
Thursday’s session high (11,562) registered within two points.
Separately, the 11,990 area marks more distant overhead. (See the May 12 review.)
The week-to-date peak (11,988) — established Tuesday — also registered within two points. Bearish price action.
Widening the view to six months adds perspective.
On this wider view, the Nasdaq is digesting the May downdraft.
Tactically, the mid-May range has been capped by its first notable resistance (11,990).
As detailed previously, follow-through atop the 11,990 area — and the more distant breakdown point (12,555) — would mark technical progress.
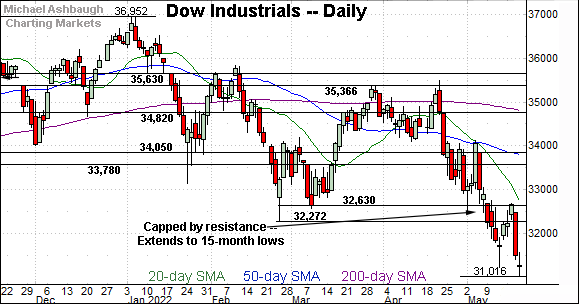
Looking elsewhere, the Dow Jones Industrial Average has extended its downtrend, tagging 15-month lows.
From top to bottom, the index has plunged 1,673 points, or 5.1%, across just three sessions.
More broadly, the Dow Jones Industrial Average is pacing an eight-week losing streak, its longest stretch since 1923.
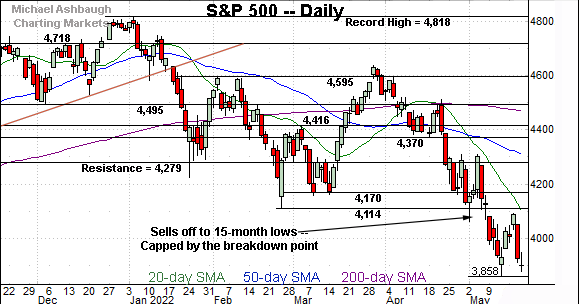
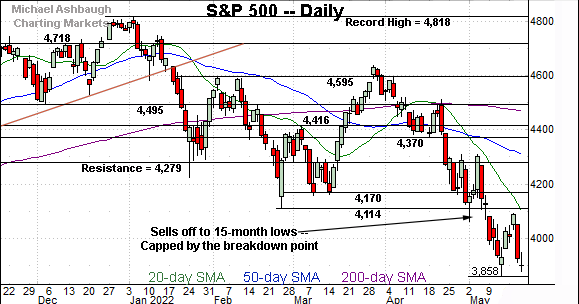
Meanwhile, the S&P 500 has not registered new lows.
Still, the index has asserted a lower plateau. Its first significant resistance (4,170) remains relatively distant.
The bigger picture
As detailed above, the prevailing bigger-picture backdrop remains firmly bearish.
On a headline basis, the Dow Jones Industrial Average has registered 15-month lows, while the Nasdaq Composite has failed consecutive tests of resistance — at 11,560 and 11,990.
As it applies to the Nasdaq, both failed tests of resistance have registered within two points. (See the hourly chart.)
Moving to the small-caps, the iShares Russell 2000 ETF (IWM) is digesting the May breakdown.
Tactically, the recent rally attempt has been fueled by decreased volume, and capped by first resistance (182.60).
To reiterate, upside follow-through atop trendline resistance and the breakdown point (188.00) would mark technical progress.
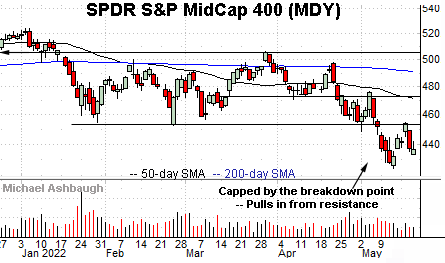
Similarly, the SPDR S&P MidCap 400 ETF (MDY) is digesting a May downdraft.
Tactically, the recent rally attempt has stalled near the breakdown point, preserving a bearish bias.
More broadly, the May downturn punctuates a three-month range, effectively capped by the 200-day moving average, a widely-tracked longer-term trending indicator.
Returning to the S&P 500, the index continues to whipsaw amid jagged price action.
As detailed Wednesday, the index rallied sharply from the May low, rising as much as 232 points, or 6.01%, across just four sessions.
This mirrored the early-May rally, a move spanning as much as 245 points, or 6.03%, across just three sessions.
By comparison, the intervening downdraft — from the May peak to the May low — spanned as much as 449 points, or 10.4%, across just seven sessions.
Combined, the price action remains consistent with a primary downtrend.
Meanwhile, the sentiment backdrop, as measured by the CBOE Volatility Index (VIX) continues to signal stubborn complacency for the prevailing market conditions. Ideally, for market bulls, the VIX would have registered a material “higher high” last week, as the S&P 500 broke to its corresponding “lower low.” (See this link detailing the VIX’ backdrop.)
The VIX still isn’t budging, in the broad sweep, leaving the S&P 500 prone to an incremental leg lower, based on the prevailing sentiment backdrop.
All told, the S&P 500’s bigger-picture trends remain bearish. An eventual rally atop the 4,170 area would be cause to reasses.
(On a granular note, a generally similar sentiment backdrop applies to the CBOE Nasdaq 100 Volatility Index (VXN). The CBOE Volatility Index (VIX) is a measure of expected S&P 500 Index options volatility over the next 30 days.)
Editor’s Note: The next review will be published Tuesday.
Repairing U.S. sub-sector damage — Levels to track
Drilling down further, extensive damage has been inflicted to the U.S. sector backdrop. Once the repair process begins — (and it has not yet begun, based on today’s backdrop) — several technical areas are worth tracking:
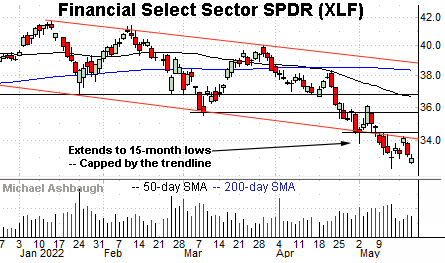
To start, the Financial Select Sector SPDR (XLF) is digesting a downdraft to 15-month lows.
Note the recent rally attempt has been fueled by decreased volume versus that pacing the early-May downdraft. Bearish price action.
Tactically, trendline resistance is closely followed by the breakdown point (34.50). Follow-through atop this area would mark a step toward stabilization.
Meanwhile, the Dow Transports (TRAN) have more recently tagged 15-month lows.
Tactically, the 14,133 and 14,375 areas mark overhead inflection points. The pending retest from underneath may add color.
More broadly, the Dow Transports and Dow industrials have concurrently registered new lows this week, confirming a primary downtrend under Dow Theory.
(Dow Theory dates back to the late 1800’s, and is derived from editorials written by Charles H. Dow, founder and first editor of The Wall Street Journal. Very generally, it’s predicated on the idea that raw materials are transported to manufacturing facilities — the industrials — then finished goods are re-transported to points of sale. It’s bearish when both groups are concurrently registering new lows. Though the U.S. economy is structured differently today, the theory still has its proponents.)
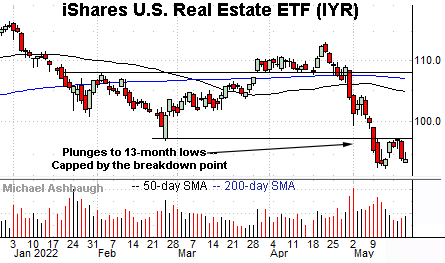
Elsewhere, the iShares U.S. Real Estate ETF (IYR) is digesting a downdraft to 13-month lows.
As illustrated, the recent rally attempt has been fueled by decreased volume, and capped by the breakdown point (97.30). Follow-through atop this area would mark technical progress.
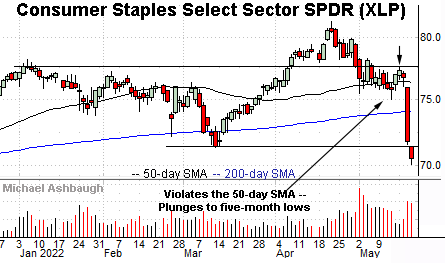
Meanwhile, the Consumer Staples Select Sector SPDR (XLP) has plunged to five-month lows.
The prevailing downturn originates from the breakdown point (77.60) and punctuates an aggressive violation of the 50-day moving average.
Tactically, the former range bottom (71.45) pivots to resistance. A reversal atop this area would place the brakes on bearish momentum.
More broadly, notice recent violations of key technical levels have been fueled by volume spikes.
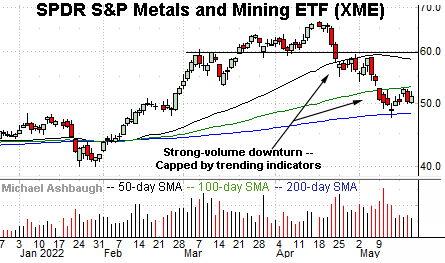
Finally, the SPDR S&P Metals & Mining ETF (XME) remains relatively stronger than the other groups. This is the only sector detailed today still positioned atop its 200-day moving average (in blue).
Still, the group is trending lower amid a downturn capped by the 50- and 100-day moving averages.
Recent pullbacks have been fueled by increased volume, and punctuated by flattish rally attempts, capped by the trending indicators. Bearish price action.
Tactically, the prevailing range top (52.64) is closely followed by the 100-day moving average, currently 53.00. Follow-through higher would signal a potential trend shift.

