Market bears resurface, Nasdaq nails first resistance (11,990) as rally attempt fades
Focus: China challenges key trendline, Utilities and Energy sector outperform, Walmart and Target plunge amid earnings misses, FXI, XLU, XLE, WMT, TGT
Technically speaking, the major U.S. benchmarks are back on the defensive, pressured amid a disappointing batch of bellwether retail sector earnings reports — from Walmart and Target.
The downturn punctuates the S&P 500’s second May rally attempt spanning almost precisely 6.00%.
Editor’s Note: As always, updates can be directly accessed at https://chartingmarkets.substack.com.
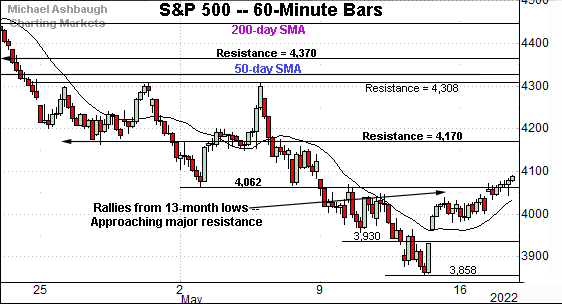
Before detailing the U.S. markets’ wider view, the S&P 500’s hourly chart highlights the past four weeks.
As illustrated, the S&P is vying to sustain a reversal from the May low.
Tactically, the 4,062 area remains an inflection point. More significant resistance (4,170) is also detailed on the daily chart.
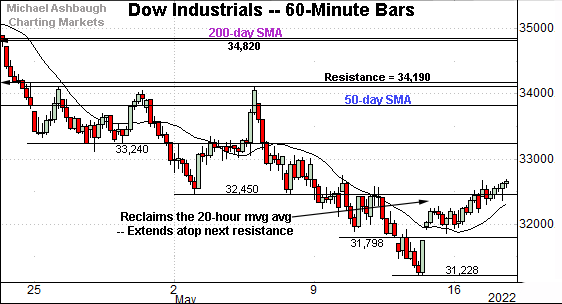
Similarly, the Dow Jones Industrial Average has reversed from its range bottom.
Recall the prevailing upturn punctuates a break atop the 20-hour moving average.
Tactically, the 32,450 area remains an inflection point.
Delving deeper, the 31,800-to-31,860 area marks notable support, detailed previously. This area has been retested early Wednesday.
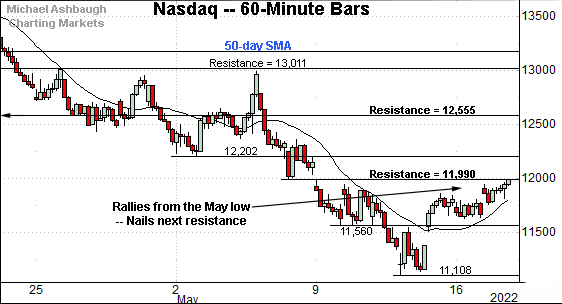
Against this backdrop, the Nasdaq Composite has tagged familiar resistance (11,990).
The specific area matches last week’s high (11,990), and the prior week’s low (11,990), detailed repeatedly.
The week-to-date peak (11,988) closely matched resistance, and selling pressure has surfaced.
Widening the view to six months adds perspective.
On this wider view, the Nasdaq has extended its reversal from the May low.
The upturn has been capped by its first notable resistance (11,990). To reiterate, the week-to-date peak (11,988) has registered within two points.
As detailed previously, follow-through atop the 11,990 area — and the more distant breakdown point (12,555) — would mark technical progress.
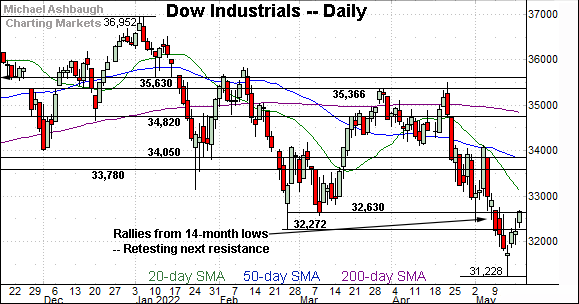
Looking elsewhere, the Dow Jones Industrial Average has reversed from 14-month lows.
The upturn seems to have stalled near the breakdown point. Follow-through atop this area would mark technical progress.
(With the benefit of this week’s price action, the designated resistance (32,630) has been bumped up slightly, about 50 points, to more closely match the March closing low rather than the absolute March low.)
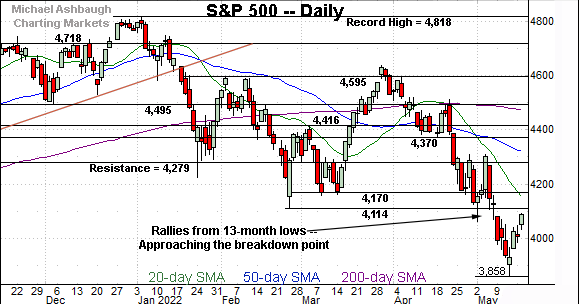
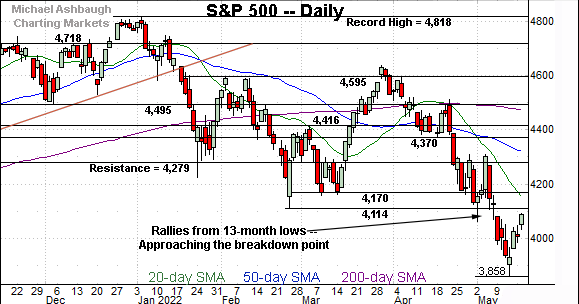
Meanwhile, the S&P 500 has not reached the February low, price action tracking more closely with the Nasdaq’s backdrop.
Its first significant resistance (4,170) remains relatively distant from current levels.
The bigger picture
If you don’t care for the prevailing market trends, simply wait a day or two and the pendulum should swing. Or so it seems, as it applies to near-term trends.
More broadly, the market whipsaws have registered within the context of a comfortably bearish bigger-picture backdrop. Each benchmark’s intermediate- to longer-term path of least resistance points lower based on today’s backdrop.
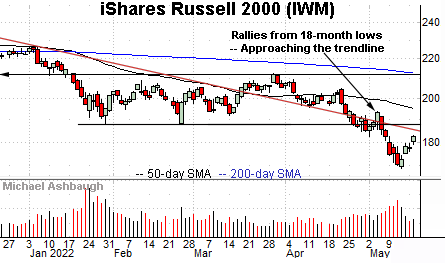
Moving to the small-caps, the iShares Russell 2000 ETF (IWM) is digesting an early-May downdraft.
The subsequent rally attempt has been fueled by decreased volume.
To reiterate, upside follow-through atop trendline resistance and the breakdown point (188.00) would mark progess.
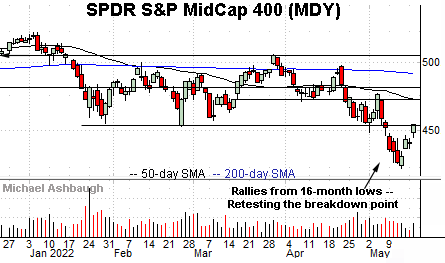
Meanwhile, the SPDR S&P MidCap 400 ETF (MDY) has rallied more respectably from the May low.
An extended retest of the breakdown point — the 452.90 area — remains underway.
Though Tuesday’s close (454.00) registered atop resistance, the MDY is firmly back on the defensive early Wednesday.
Returning to the S&P 500, the index has whipsawed from the May low.
From bottom to top, the four-session rally spanned 232 points, or 6.01%.
This mirrors the early-May rally, a move that spanned as much as 245 points, or 6.03%, across just three sessions.
By comparison, the intervening downdraft — from the May peak to the May low — spanned as much as 449 points, or 10.4%, across just seven sessions.
So this is price action consistent with a primary downtrend.
Elsewhere, Friday’s initial reversal off the low — an impressive 11-to-1 up day — has not yet been matched by comparable upside follow-through. (See Monday’s review for added detail regarding the internals.)
Separately, the sentiment backdrop, as measured by the CBOE Volatility Index (VIX) remains inconsistent with the view that the S&P 500’s May low marked the terminal low. The S&P 500 remains prone to an incremental leg lower, based on the prevailing sentiment backdrop.
All told, the S&P 500’s bigger-picture trends remain bearish. An eventual rally atop the 4,170 area would be cause to reasses.
Watch List — China challenges key trendline
Drilling down further, the iShares China Large-Cap ETF (FXI) has reached a key test.
Specifically, the shares are pressing trendline resistance closely tracking the 50-day moving average, currently 30.94.
On further strength, additional overhead matches the May peak (31.69). Upside follow-through would punctuate a “higher high” more firmly signaling a trend shift.
Based on today’s backdrop, the intermediate-term downtrend is intact.
Pockets of sector strength narrow
Moving to U.S. sectors, increasingly narrow pockets of strength persist. Two groups stand out:
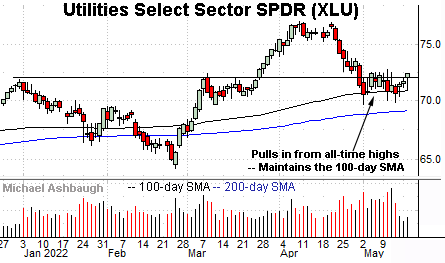
To start, the Utilities Select Sector SPDR (XLU) is acting relatively well technically. (Yield = 2.7%.)
The prevailing pullback from all-time highs has been orderly, in the broad sweep, thus far inflicting limited damage.
Tactically, the breakout point (72.00) is followed by the 100-day moving average, currently 70.86, a recent bull-bear inflection point. A sustained posture atop this area signals a bullish bias.
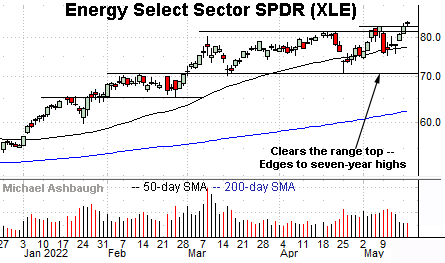
Elsewhere, the Energy Select Sector SPDR (XLE) continues to outperform, rising amid surging energy prices. (Yield = 3.9%.)
As illustrated, the group has edged to seven-year highs despite a down market.
The prevailing upturn punctuates a successful test of the range bottom (70.40) at the April low. An intermediate-term target continues to project to the 92 area.
More broadly, the group has edged atop major resistance — illustrated on the five-year chart — opening the path to potentially material longer-term follow-through. (See the May 5 review for added detail.)
Moving to commodities, the Teucrium Wheat Fund (WEAT) — profiled last week — has indeed broken out.
In the process, the shares have tagged two-month highs, rising amid increased volume.
The prevailing upturn positions the shares to build on the massive early-March spike. Tactically, gap support (11.66) is followed by the breakout point (11.30). (Also see the May 12 review.)
Bellwether retail names stage damaging downdrafts
Concluding on a negative note, two bellwether retail names have posted major earnings misses this week.
To start, Dow 30 component Walmart, Inc. (WMT) has plunged to 22-month lows, pressured after reporting disappointing first-quarter results, and reducing its full-year forecast.
The downturn places the shares firmly within view of pre-pandemic prices, illustrated on the five-year chart.
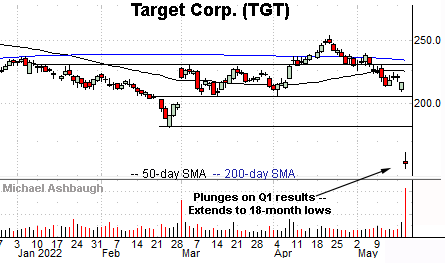
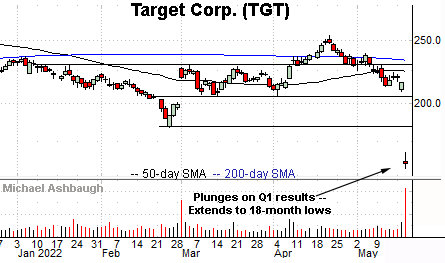
Meanwhile, Target Corp. (TGT) has plunged to 18-month lows, also pressured after an ugly first-quarter report.
In the process, the shares are pacing their worst day since 1987, amid an intraday plunge exceeding 26%.
More broadly, the shares have reached a less-charted patch — hinged to the steep pandemic-fueled rally — illustrated on the five-year chart. The prevailing backdrop is low risk/reward.

