Dow industrials punctuate head-and-shoulders top, even as VIX signals stubborn complacency
Focus: Volatility Index signals complacency even amid broadly-based technical damage
Technically speaking, the major U.S. benchmarks continue to trend lower, pressured as volatile price action persists.
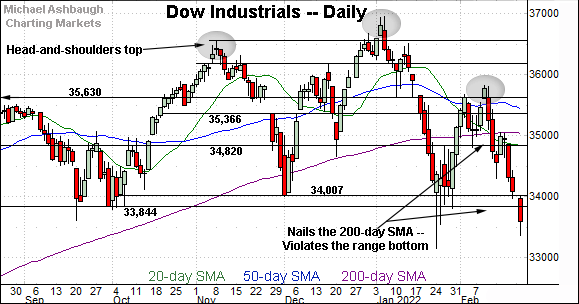
Against this backdrop, the Dow Jones Industrial Average has plunged from a head-and-shoulders top, a high-reliability bearish technical pattern. The quality of the pending recovery attempt, or lack thereof, will likely add color.
Editor’s Note: As always, updates can be directly accessed at https://chartingmarkets.substack.com.
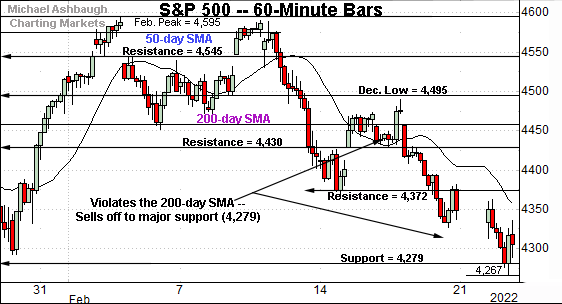
Before detailing the U.S. markets’ wider view, the S&P 500’s hourly chart highlights the past four weeks.
As illustrated, the S&P has extended its downturn.
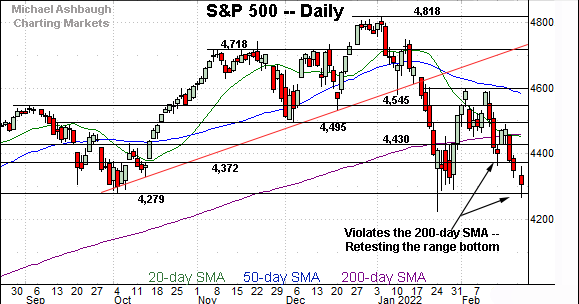
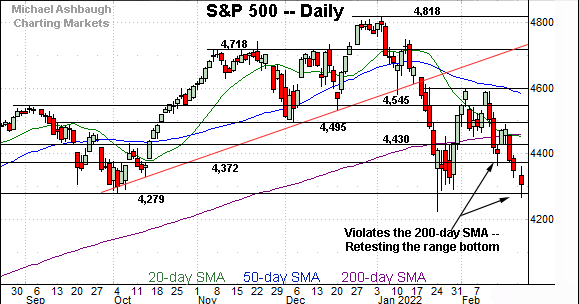
Recent weakness places major support (4,279) under siege, an area better illustrated on the daily chart.
Wednesday’s early session low (4,274) registered nearby.
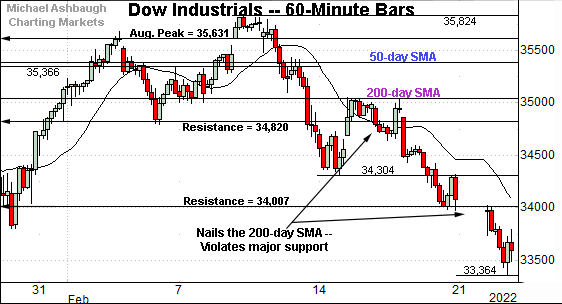
Meanwhile, the Dow Jones Industrial Average has broken down technically.
Specifically, the index has violated the 34,000 mark, an important bull-bear fulcrum, better illustrated on the daily chart.
Slightly more broadly, the prevailing downturn punctuates a failed test of the 200-day moving average from underneath. Bearish price action.
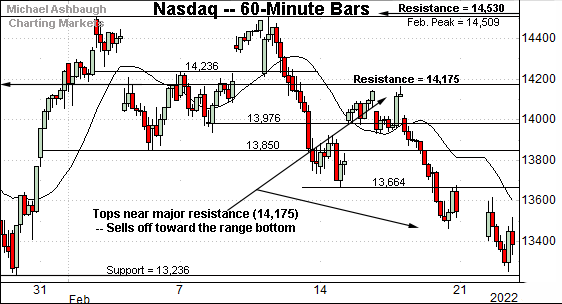
Against this backdrop, the Nasdaq Composite is pressing its range bottom.
The prevailing pullback originates from major resistance (14,175), an area also illustrated below.
More immediately, deeper support (13,236) matches the one-month range bottom.
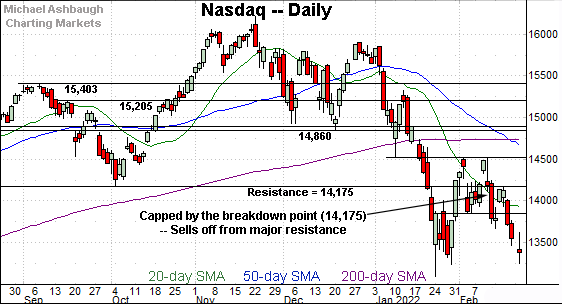
Widening the view to six months adds perspective.
On this wider view, the Nasdaq is traversing a less-charted patch.
The prevailing downturn punctuates consecutive failed tests of well-defined resistance — the 14,530 area and the former breakdown point (14,175).
Also recall the latest leg lower dovetails with a death cross, or bearish 50-day/200-day moving average crossover, an event that signaled Friday.
Tactically, the Nasdaq’s bigger-picture backdrop remains bearish pending follow-through atop resistance (14,530) and the major moving averages.
Looking elsewhere, the Dow Jones Industrial Average has broken down technically.
The prevailing downturn punctuates a head-and-shoulders top, defined by the November, January and February peaks.
Tactically, this is a high-reliability bearish reversal pattern, in this case tied to the primary trend. Recall last week’s high almost precisely matched the 200-day moving average to punctuate a failed test from underneath.
From current levels, the breakdown point — the 34,000 area — pivots to resistance. An eventual close higher would mark an early step toward stabilization. (The 34,000 area also defines the pattern’s neckline.)
Conversely, the prevailing downturn opens the path to a potential test of the 32,000 area, closely matching the February 2021 peak (32,009).
Meanwhile, the S&P 500 has plunged to its range bottom.
Recall major support matches the October low (4,279), an area that remains under siege.
Separately, Tuesday’s close (4,304.8) marked a four-month closing low to punctuate the S&P 500’s first 10% correction in almost exactly two years, going back to February 2020 as the pandemic was kicking off.
The bigger picture
As detailed above, the U.S. markets are not acting well technically.
On a headline basis, each big three benchmark’s intermediate- to longer-term bias remains bearish, pending repairs.
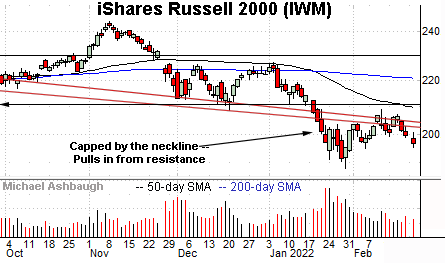
Moving to the small-caps, the iShares Russell 2000 ETF continues to trend lower.
Tactically, the small-cap benchmark has stalled near the neckline of its head-and-shoulders top. (See the Dow industrials’ corresponding pattern, and pending retest.)
Slightly more distant overhead matches the breakdown point, an area broadly spanning from 208.75 to 211.10.
More broadly, the prevailing downturn originates from the January peak, a level matching the 50-day moving average, and the late-November omicron-fueled gap. Bearish price action.
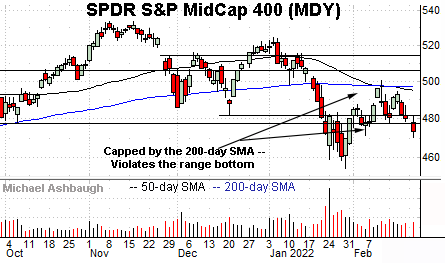
Meanwhile, the SPDR S&P MidCap 400 ETF remains comparably stronger than the Russell 2000, though its prevailing backdrop is nonetheless firmly-bearish.
Tactically, the MDY has staged a flattish February rally attempt, stalling near the 50- and 200-day moving averages.
More immediately, the prevailing downturn places the MDY back under its former breakdown point (477.50), a move signaling bearish momentum is intact.
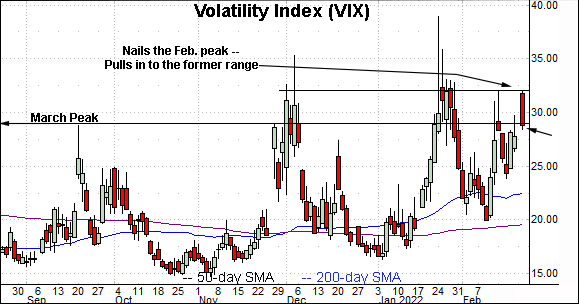
Moving to market sentiment, the Volatility Index (VIX) — a widely-tracked market-fear gauge — has come to life.
As always, extreme VIX highs signal excessive fear, consistent with durable S&P 500 lows.
Conversely, extreme VIX lows signal investor complacency, consistent with S&P 500 tops.
Against the current backdrop, the Volatility Index has nailed the Feb. peak (32.04) at the week-to-date peak (32.04) — to the decimal. The VIX subsequently reversed, pulling in to close Tuesday narrowly within the former range.
The price action is notable as the S&P 500 registered a four-month closing low Tuesday.
At the same time, the Volatility Index closed firmly under the December and January closing peaks.
Combined, the S&P 500 has registered a material “lower low” while the Volatility Index did not register a corresponding “higher high.” This is a dog that did not bark syndrome.
Ideally, the VIX would register new highs — signaling the excessive fear, or a capitulatory backdrop — consistent with a durable S&P 500 low.
More plainly, the S&P 500 remains vulnerable to incremental downside based on the prevailing sentiment backdrop. (Also see the Jan. 14 review, detailing the Nasdaq Composite’s comparable sentiment vulnerability. The Nasdaq has subsequently followed through as much as 9.8% lower on a closing basis.)
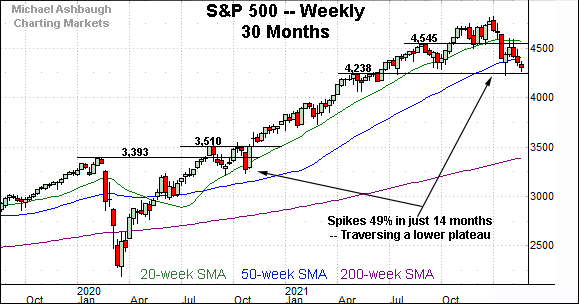
More broadly, the S&P 500 is digesting a massive 14-month, 49.0% rally from the November 2020 low (3,233) — just before the U.S. election — to the January 2022 peak (4,818).
Tactically, the January downdraft, from record highs, has been punctuated by six weeks traversing a lower plateau.
As always, trading ranges are more frequently exited in the direction in which they were entered.
So here again, the monthly backdrop — including the S&P 500’s failed test of major resistance (4,545) from underneath — signals an index vulnerable to incremental downside.
Returning to the S&P 500’s daily chart, the index has asserted a firmly-bearish bigger-picture backdrop.
On a headline basis, this week’s downside follow-through punctuates a 10% correction, the S&P 500’s first in two years. (The S&P 500 has registered a 10.25% correction on a closing basis.)
Amid the downturn, the index continues to violate all kinds of technical support, frequently on the first test. Bearish momentum is intact.
More immediately, the S&P 500 has reached its second recent test of major support (4,279) a level matching the range bottom. Wednesday’s early session low (4,274) registered nearby.
The prevailing retest of this area — across potentially the next few sessions — will likely add color. On further weakness, downside targets rest in the 4,233-to-4,238 area, and around 4,190.
Beyond specific levels, the S&P 500’s prevailing backdrop supports a bearish longer-term bias, pending repairs. An eventual rally atop the 200-day moving average, and the 4,495 resistance, would be cause to reassess.
No new setups today.


