Charting a stealth breakout: S&P 500 ventures atop 50-day average
Focus: U.S. sector backdrop strengthens, Financials tag record highs, Transports extend trendline breakout, XLF, TRAN, QQQ, XLE, XLI, XME
U.S. stocks are higher mid-day Friday, rising after a strong batch of earnings reports and well received retail sales data.
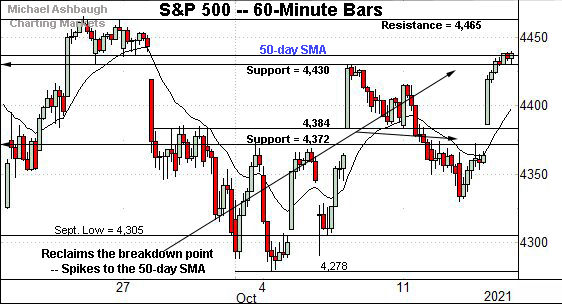
Against this backdrop, the S&P 500 has extended its rally atop the 50-day moving average, currently 4,437, reaching a potentially consequential technical test (4,465).
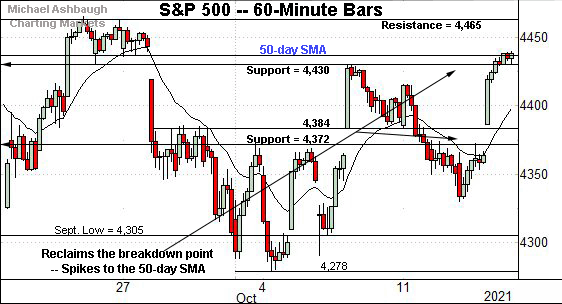
Before detailing the U.S. markets’ wider view, the S&P 500’s hourly chart highlights the past four weeks.
As illustrated, the S&P has come to life technically, rising to challenge the 50-day moving average, currently 4,437.
Thursday’s close (4,438) registered just above the 50-day, and the S&P has extended its rally attempt early Friday.
Tactically, additional overhead matches the late-September peak (4,465).
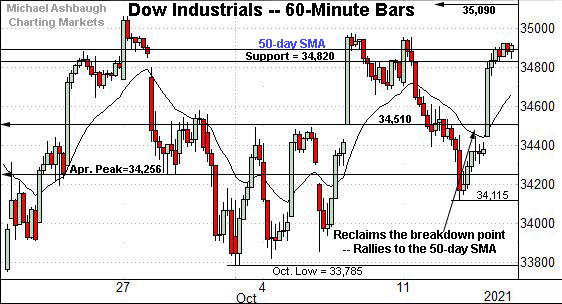
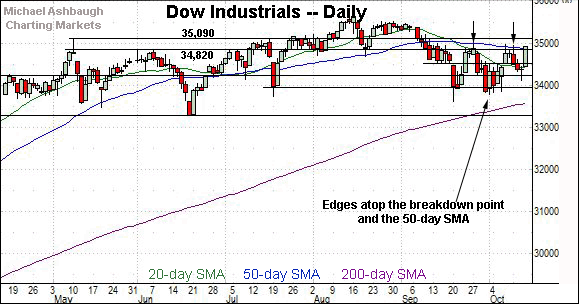
Similarly, the Dow Jones Industrial Average has rallied toward its range top.
Here again, the prevailing upturn places the 50-day moving average, currently 34,879, under siege.
Thursday’s close (34,912) registered slightly atop the 50-day, and the Dow has followed through more firmly higher early Friday.
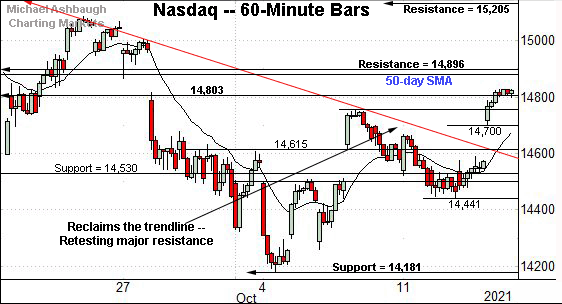
Perhaps not surprisingly, the Nasdaq Composite remains the weakest major benchmark.
Still, the index has gapped atop its trendline, rising to challenge major resistance — the 14,800-to-14,900 area — detailed repeatedly.
Friday’s early session high (14,904) has roughly matched resistance. The weekly close will likely add color.
(This is the lone major benchmark not to clear its 50-day moving average, currently 14,869, though a retest is underway early Friday.)
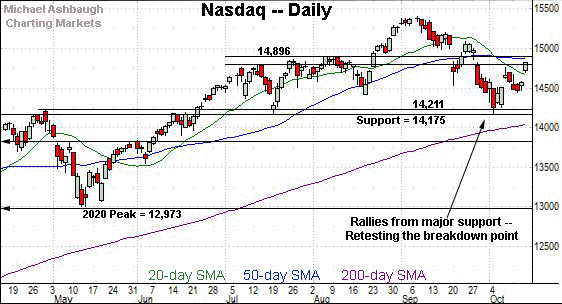
Widening the view to six months adds perspective.
On this wider view, the Nasdaq is challenging its breakdown point, an area broadly spanning from 14,803 to 14,896.
As detailed repeatedly, this area marks an intermediate-term bull-bear fulcrum. Sustained follow-through atop the 14,900 area would signal a bullish-leaning intermediate-term bias.
To reiterate, Friday’s early session high (14,904) has effectively matched major resistance.
Looking elsewhere, the Dow Jones Industrial Average has come to life with a sharp single-day spike.
In the process, the index has reclaimed its former breakdown point (34,820) and the 50-day moving average, currently 34,879.
This marks the Dow’s first close atop the 50-day moving average since Sept. 8.
The prevailing upturn marks the third recent test of resistance. As always, major resistance is frequently cleared on the third or fourth independent test.
Slightly more distant overhead matches the May peak (35,091). Sustained follow-through atop this area would signal a bullish intermediate-term bias, as detailed repeatedly.
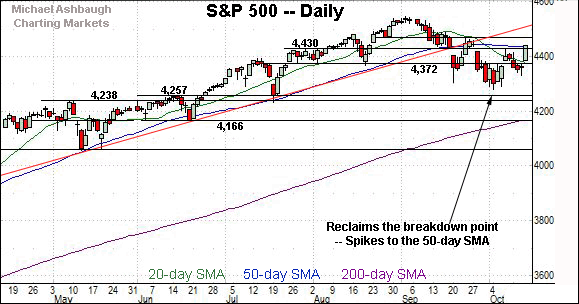
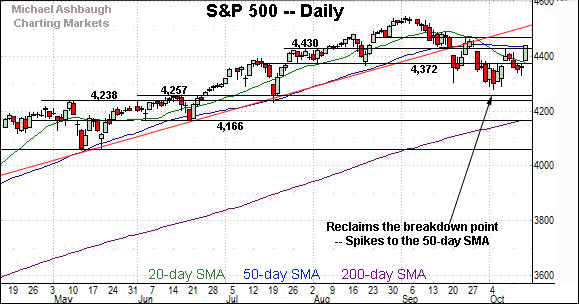
Similarly, the S&P 500 has edged atop notable resistance.
The specific area matches the former breakdown point (4,430) and the 50-day moving average, currently 4,437. (Also see the hourly chart.)
The bigger picture
As detailed above, the U.S. benchmarks remain in divergence mode — each index is doing slightly different things — though the bigger-picture backdrop has strengthened in key spots.
On a headline basis, the S&P 500 and Dow industrials have ventured back atop their respective 50-day moving averages, rising amid a stealth single-day spike.
Consider that Thursday marked the S&P 500’s biggest single-day rally since March.
Meanwhile, the Nasdaq Composite continues to lag behind, though a retest of major resistance — the 14,900 area — remains underway Friday.
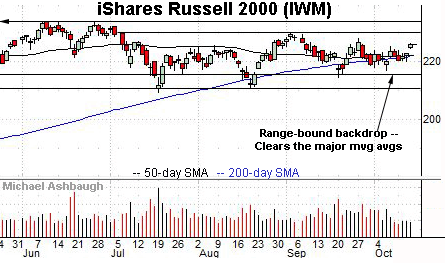
Moving to the small-caps, the iShares Russell 2000 ETF remains range-bound.
Within the range, the small-cap benchmark has ventured atop its 50- and 200-day moving averages, rising amid lackluster volume.
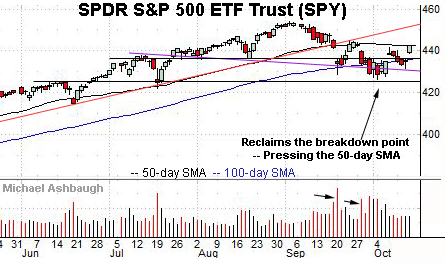
Looking elsewhere, the SPDR Trust S&P 500 ETF seems to have weathered a potentially consequential technical test.
Recall the developing head-and-shoulders top — a high-reliability bearish reversal pattern — defined by the mid-August, early-September and late-September peaks.
Tactically, a material violation of the neckline (in purple) would resolve the pattern, incrementally damaging the bigger-picture backdrop
Instead, the SPY knifed sharply from the neckline, rising to challenge its 50-day moving average, currently 442.66. (Thursday’s close (442.50) registered fractionally under the 50-day.)
Tactically, eventual follow-through atop the 50-day moving average — and the late-September peak (444.89) — would technically neutralize the developing head-and-shoulders top.
Market internals raise question mark amid bullish reversal
Moving to the internals, the prevailing upturn has “room to improve” as it applies to breadth and momentum.
For instance, Thursday’s upturn registered lackluster total volume and relatively tame market breadth. NYSE advancing volume surpassed declining volume by about a 3-to-1 margin.
Put differently, the internal statistics stand out as unusually lackluster considering Thursday marked the strongest single-day gain in seven months.
Nonetheless, price action trumps other indicators.
Returning to price action, the S&P 500 has knifed to its 50-day moving average, currently 4,437.
To reiterate, Thursday’s close (4,438) registered slightly above the 50-day. Friday’s weekly close will likely add color.
More broadly, the S&P 500 has knifed straight through its former range — the 4,372-to-4,430 area — across a single session.
So combined, the S&P 500 has not only averted a head-and-shoulders top breakdown — (see the SPY’s chart) — it has reclaimed three major technical levels. (The 4,372 resistance, the 4,430 resistance, and the 50-day moving average.)
This potentially consequential price action has registered across a single session — the S&P 500’s best day in seven months — fueled by lackluster volume and breadth.
Put differently, Thursday’s spike did not register as a conventional cornerstone stake-in-the-ground bullish reversal — far from it — though the price action itself is indeed bullish.
Tactically, follow-through atop the the late-September peak (4,465) would mark a material “higher high” — neutralizing the S&P 500’s developing head-and-shoulders top — and more firmly signaling a bullish intermediate-term bias.
The weekly close, and the next several sessions, may add color.
Watch List — Charting the traditional sector leaders
Drilling down further, the U.S. sub-sector backdrop has strengthened, though familiar cross currents are intact. The traditional sector leaders — the financials, transports and technology sector — exemplify the backdrop:
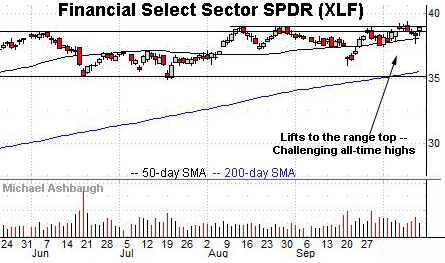
To start, the Financial Select Sector SPDR — profiled last week — continues to outperform.
As illustrated, the group has held tightly to its range top, challenging record highs amid market volatility.
The prevailing upturn punctuates a head-and-shoulders bottom defined by the August, September and October lows. A near-term target continues to project to the 40.30 area on follow-through.
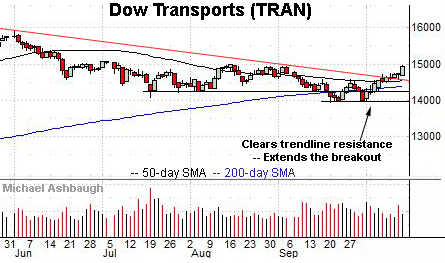
Meanwhile, the Dow Transports — most recently profiled Wednesday — have extended a trendline breakout.
In the process, the group is pressing next resistance matching the September peak (14,936).
Thursday’s close (14,943) registered nominally atop resistance, and the group has extended its rally attempt early Friday.
To reiterate, sustained follow-through atop this area would mark a material “higher high” confirming the initial trendline breakout.
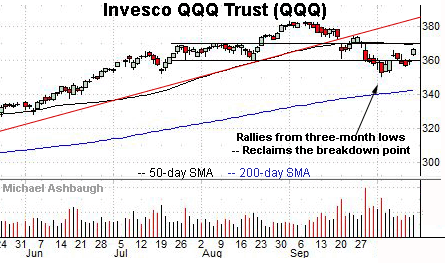
Scaling down in strength, the Invesco QQQ Trust tracks the Nasdaq 100 Index making it a large-cap technology sector proxy.
Technically, the shares have reclaimed the breakdown point, circa 360.00, tagging a month-to-date peak.
More distant overhead matches the 50-day moving average, currently 369.38, and the former range top (369.90). The QQQ’s intermediate-term bias remains bearish-leaning pending follow-through atop this area.
Energy sector remains pocket of strength
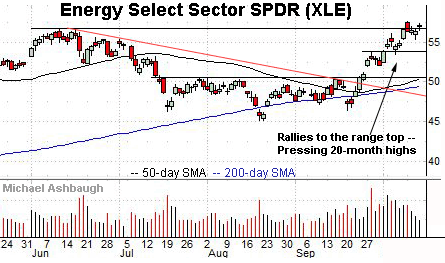
Moving to a pocket of strength, the Energy Select Sector SPDR — initially profiled Sept. 24, amid the trendline breakout — continues to challenge 20-month highs.
The prevailing tight one-week range, formed amid decreased volume, improves the chances of an eventual breakout.
Tactically, a breakout attempt is in play barring a violation of near-term support, circa 54.10. (Recall the prevailing upturn punctuates a head-and-shoulders bottom, defined by the July, August and September lows.)
Influential sectors reach key technical tests
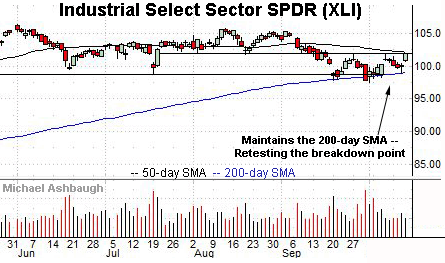
Looking elsewhere, the Industrial Select Sector SPDR has reached a key technical test.
Specifically, the group is challenging its breakdown point (101.80) an area closely matching the 50-day moving average. Sustained follow-through atop this area would signal a bullish-leaning bias.
More broadly, the prevailing upturn punctuates a successful test of the 200-day moving average, an area roughly matching the group’s six-month range bottom.
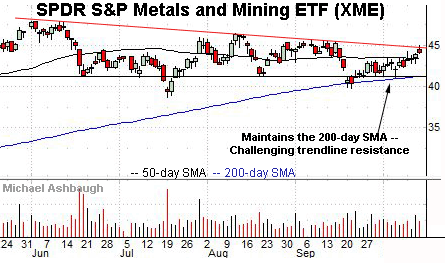
Finally, the SPDR S&P Metals and Mining ETF is challenging trendline resistance.
Here again, the prevailing upturn originates from the 200-day moving average at the October low.
More immediately, the 50-day moving average, currently 43.46, matches a recent inflection point. A breakout attempt is in play barring a violation.


