Charting bearish momentum, S&P 500 approaches downside target (3,800)
Focus: Crude oil's stealth breakout attempt, Wheat sustains May breakout, Energy and Utilities continue to outperform, USO, WEAT, XLE, XLU
Technically speaking, the major U.S. benchmarks remain on the defensive, pressured as concerns regarding the corporate-earnings landscape intensify.
Social media platform Snap, Inc. marks the latest earnings-related casualty — plunging as much as 40% intraday — after the company issued a poorly-received profit warning.
Editor’s Note: As always, updates can be directly accessed at https://chartingmarkets.substack.com.
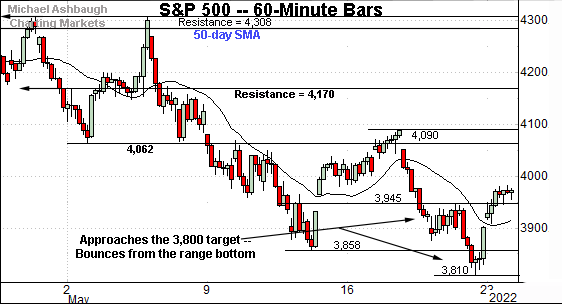
Before detailing the U.S. markets’ wider view, the S&P 500’s hourly chart highlights the past four weeks.
As illustrated, the S&P continues to whipsaw amid jagged May price action.
Tactically, the 3,945 area marks an inflection point. Consecutive session highs last week registered within two points.
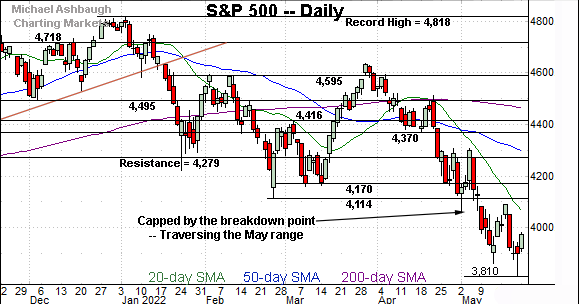
Delving deeper, the May low (3,810), established Friday, has registered near the S&P’s downside target — the 3,800 area — detailed previously.
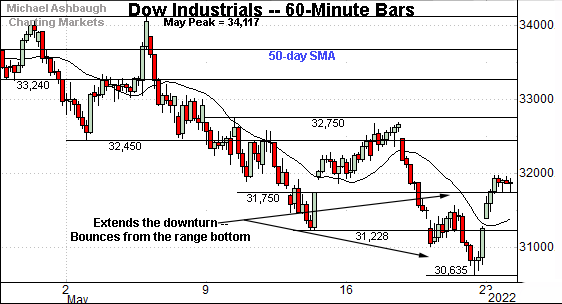
Similarly, the Dow Jones Industrial Average has rallied from its range bottom, rising after briefly tagging new lows.
Amid the volatility, nearby technical levels are not so well-defined. The 31,750 area marks an inflection point.
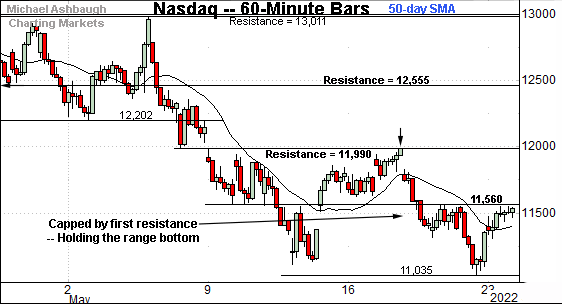
Against this backdrop, the Nasdaq Composite has registered more technical price action.
Tactically, recall the 11,560 area marks an inflection point. (See Wednesday’s review.)
Thursday’s session high (11,562), Friday’s high (11,552) and Monday’s session high (11,552) registered nearby.
Slightly more broadly, the 11,990 area marks more distant overhead. (See the May 12 review.)
Last week’s high (11,988) effectively matched resistance. The consecutive failed retests from underneath are bearish.
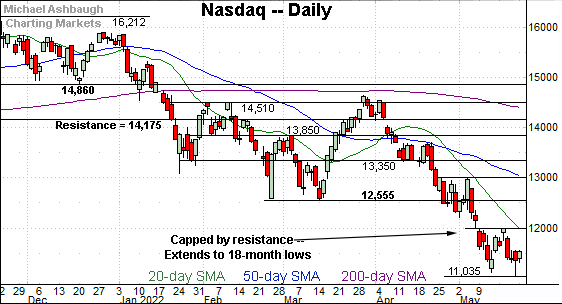
Widening the view to six months adds perspective.
On this wider view, the Nasdaq continues to digest the May downdraft.
To reiterate, the mid-May range has been capped by resistance (11,990) — almost precisely.
Tactically, eventual follow-through atop the 11,990 area — and the more distant breakdown point (12,555) — would mark technical progress.
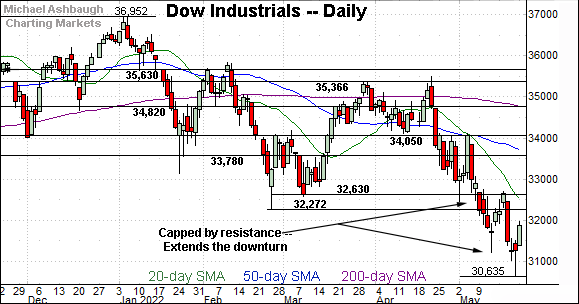
Looking elsewhere, the Dow Jones Industrial Average continues to trend lower, though amid wide-ranging price action.
Recent long-tailed daily reversals — punctuated by closes firmly off the session lows — signal that dip-buyers remain present.
Combine this with a still-complacent sentiment backdrop — detailed last week — and the major benchmarks remain prone to incremental downside, based on today’s backdrop.
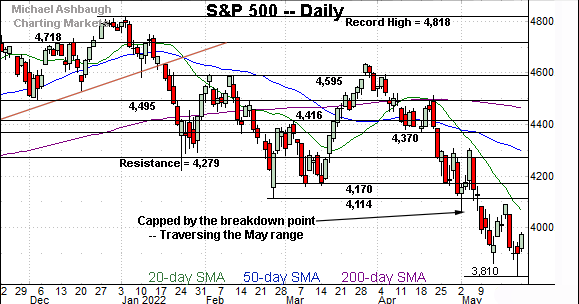
Meanwhile, the S&P 500 has approached its downside target around the 3,800 mark, an area detailed repeatedly.
See the April 27 review: S&P 500 rallies from major support (4,170) even as bigger-picture backdrop deteriorates.
Amid the volatiliity, the May closing lows — at 3,900 and 3,901 — mark the lowest closes since March 2021.
The bigger picture
As detailed above, the major U.S. benchmarks continue to trend broadly lower.
On a headline basis, each big three U.S. benchmark has registered at least 14-month lows, pressured amid a downtrend punctuated by sometimes spectacular, but still strikingly short-lived bear-market rally attempts.
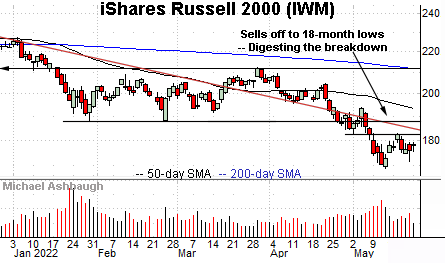
Moving to the small-caps, the iShares Russell 2000 ETF (IWM) is largely treading water.
The initial strong-volume early-May downdraft has been punctuated by a comparably flat rally attempt. Bearish price action.
Tactically, initial resistance (182.60) is followed by the trendline, and the firmer breakdown point (188.00). Follow-through higher would mark technical progress.
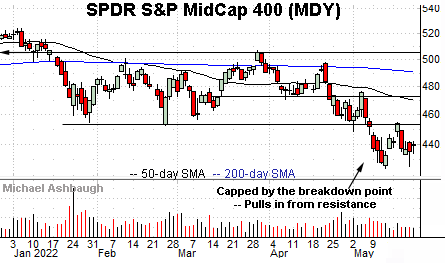
Similarly, the SPDR S&P MidCap 400 ETF (MDY) is digesting a May downdraft.
Recall the mid-May rally attempt stalled near the breakdown point, preserving a bearish bias.
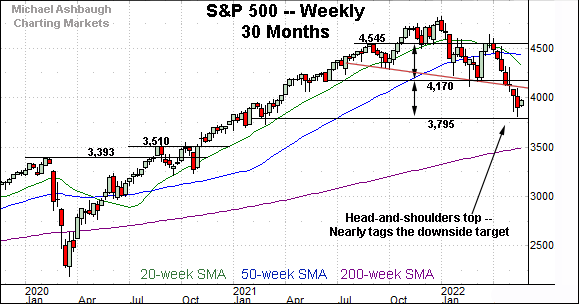
Returning to the S&P 500, this next chart is a weekly view, spanning 30 months. Each bar on the chart represents one week.
As illustrated, the May downdraft punctuates a head-and-shoulders top, defined by the September, January and March peaks.
Recall a downside target projects from the former range to the 3,800 area. (Start with 4,545 - 4,170 = 375 points. Then, subtract the result from the breakdown point: 4,170 - 375 = 3,795. Also see the April 29 review, and prior reviews.)
Against this backdrop, the May low (3,810) — established Friday — has registered near the downside target. The index subsequently rallied respectably, rising as much as 4.5% across just two sessions.
Tactically, the April close (4,131) effectively matched the pattern’s neckline. So the 4,130-to-4,170 area broadly marks major resistance. Eventual follow-through atop this area would mark a step toward stabilization.
Returning to the six-month view, the S&P 500 is traversing a lower plateau.
Amid the volatility, the mid-May rally attempt stalled firmly under major resistance (4,170). Recall the steep late-March rally originated from the 4,170 mark.
Against this backdrop, the S&P 500’s bigger-picture trends remain firmly-bearish. Eventual follow-through atop the 4,170 area would be cause to reasses. As always, it’s not just what the markets do, it’s how they do it.
Also see May 20: Nasdaq nails first resistance (again) as VIX signals stubborn complacency.
Watch List
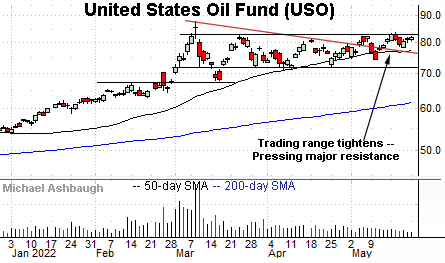
Drilling down further, the United States Oil Fund (USO) is acting well technically. The fund tracks the spot price of light, sweet crude oil.
As illustrated, the shares have asserted a tight May range, holding relatively tightly to major resistance.
Widening slightly, the prevailing 10-week range is a bullish continuation pattern, hinged to the aggressive early-March breakout. The prevailing backdrop positions the shares to build on that initial strong-volume spike.
Tactically, the 50-day moving average, currently 77.40, is followed by the May low (74.22). A breakout attempt is in play barring a violation. (The shares have registered just one close below the 50-day moving average year-to-date.)
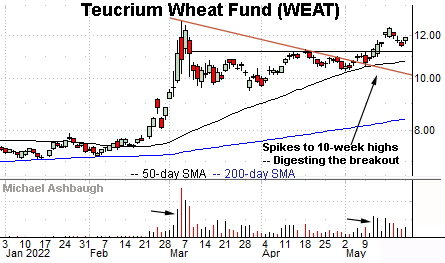
Elsewhere, the Teucrium Wheat Fund (WEAT) — a fund consisting of wheat futures contracts — is also technically well positioned.
Earlier this month, the shares knifed to 10-week highs, rising amid a sustained volume increase. The subsequent pullback has been comparably flat, positioning the shares to extend the uptrend.
More broadly, the shares are also positioned for potentially material follow-through on the massive early-March spike.
Tactically, the breakout point (11.30) is followed by the ascending 50-day moving average, currently 10.80. A sustained posture higher signals a bullish bias.
Sector strength remains narrow
Moving to U.S. sectors, pockets of strength remain unsually narrow. Two familiar groups stand out:
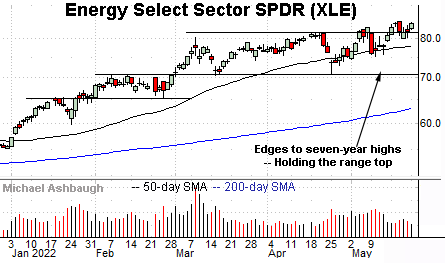
To start, the Energy Select Sector SPDR (XLE) continues to outperform. (Yield = 3.9%.)
As illustrated, the group has briefly tagged seven-year highs, and is holding the range top. The absence of selling pressure — even amid a firmly down market — improves the chances of a more decisive breakout.
Tactically, an intermediate-term target continues to project from the former range to the 92 area.
More broadly, the group has edged atop major resistance illustrated on the five-year chart. Inflection points match the 2018 peak (79.42) and the April 2022 peak (81.50).
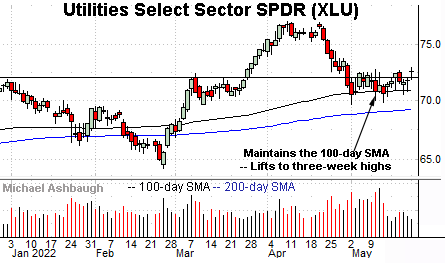
Finally, the Utilities Select Sector SPDR (XLU) is also acting relatively well amid carnage elsewhere. (Yield = 2.7%.)
The recent pullback from all-time highs — though fueled by increased volume — has inflicted limited damage in the broad sweep.
Tactically, the breakout point (72.00) is followed by the 100-day moving average, currently 70.90. A sustained posture higher signals a bullish bias.


