Charting bearish momentum, S&P 500 confirms downtrend amid inflation concerns
Focus: Europe challenges key level, Wheat's breakout attempt, Transports and Silver press major support, Apple's backdrop starts to crack, IEV, WEAT, TRAN, SLV, AAPL
Technically speaking, the major U.S. benchmarks continue to trend lower, pressured amid inflation concerns, and a prolonged volatility spike.
Against this backdrop, the S&P 500 has tagged its latest 13-month low, placing distance under the marquee 4,000 mark.
Editor’s Note: As always, updates can be directly accessed at https://chartingmarkets.substack.com.
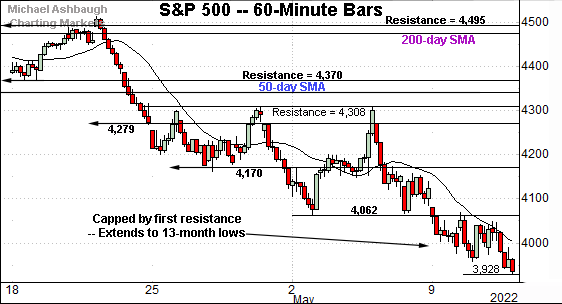
Before detailing the U.S. markets’ wider view, the S&P 500’s hourly chart highlights the past four weeks.
As illustrated, the S&P has once again extended its downturn.
Tactically, the breakdown point — the 4,062 area — pivots to resistance.
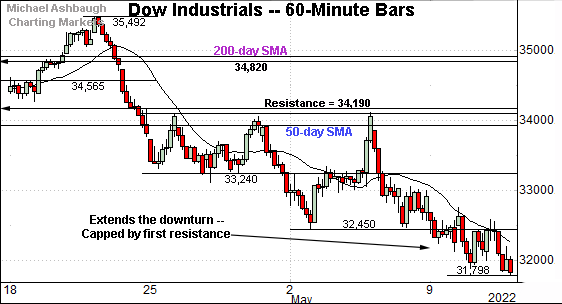
Similarly, the Dow Jones Industrial Average continues to trend lower.
Amid the downturn, the early-May low (32,450) remains an inflection point.
Slightly more broadly, the May downturn originates from the breakdown point, an area roughly matching the 50-day moving average.
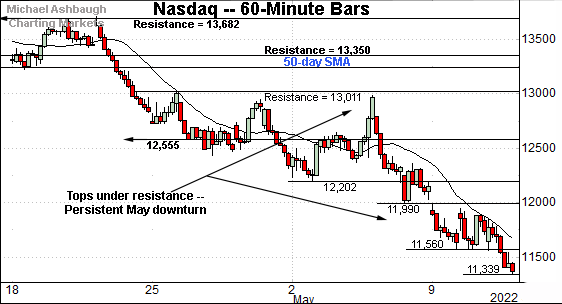
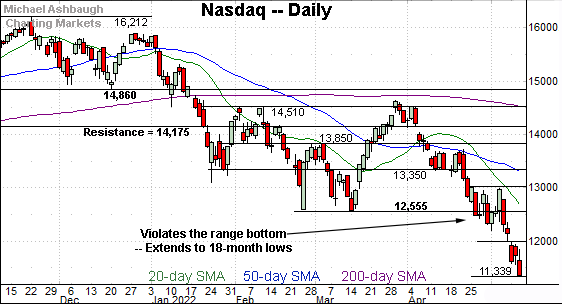
True to recent form, the Nasdaq Composite remains the weakest major benchmark.
Its prevailing downturn has spanned as much as 12.5% across just six sessions.
Tactically, the 11,560 area marks an overhead inflection point. More distant overhead (11,990) matches last week’s low and the week-to-date high.
Widening the view to six months adds perspective.
On this wider view, the Nasdaq has extended its May downturn. The prevailing pullback originates from the 13,000 mark.
More broadly, the aggressive downside follow-through confirms the Nasdaq’s bearish longer-term bias.
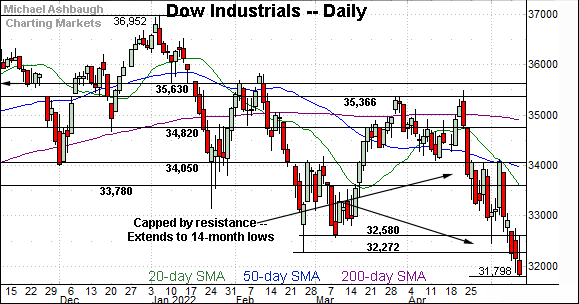
Looking elsewhere, the Dow Jones Industrial Average has tagged 14-month lows.
The downturn originates from resistance in the 34,050 area.
Here again, the prevailing pullback punctuates a material “lower low,” confirming the Dow’s bearish longer-term bias.
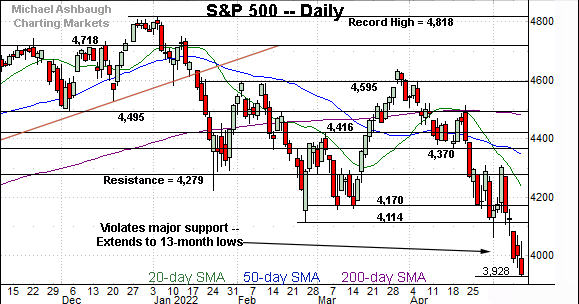
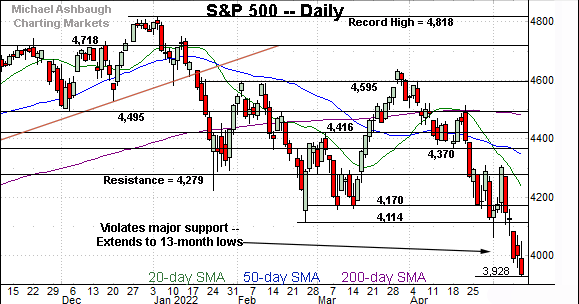
Meanwhile, the S&P 500 has tagged its latest 13-month low.
Broadly speaking, the prevailing downturn originates from the 200-day moving average — the 4,495 area — at the mid-April peak.
As always, the 200-day moving average is a widely-tracked longer-term trending indicator.
The bigger picture
As detailed above, the major U.S. benchmarks are trending broadly lower, pressured amid a prolonged volatility spike.
Against this backdrop, each big three benchmark has confirmed its primary downtrend this week.
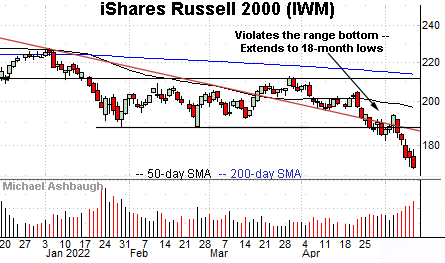
Moving to the small-caps, the iShares Russell 2000 ETF has tagged 18-month lows, pressured amid a sustained volume increase.
Tactically, a downside target projects from the former range to the 165 area.
Conversely, the breakdown point (188.00) roughly matches the former trendline, and pivots to resistance.
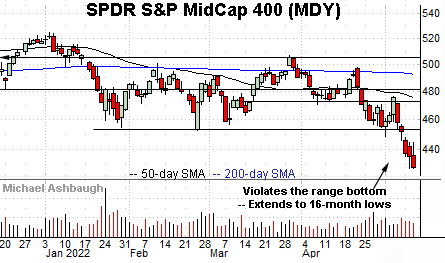
Meanwhile, the SPDR S&P MidCap 400 ETF has extended to 16-month lows.
Here again, the breakdown point — the 452.90 area — pivots to resistance.
Conversely, the MDY’s corresponding downside target projects to slightly above the 400 mark.
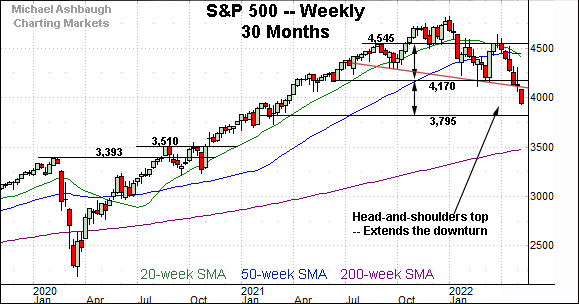
Returning to the S&P 500, this next chart is a weekly view, spanning 30 months. Each bar on the chart represents one week.
As illustrated, the S&P has extended its downturn.
The May downdraft punctuates a head-and-shoulders top, defined by the September, January and March peaks.
Tactically, a downside target projects to just under the 3,800 mark, as detailed previously. (See the April 29 review, as well as prior reviews.)
Returning to the six-month view, the S&P 500 has confirmed its downtrend, pressured amid seriously aggresssive selling pressure.
Recall the prevailing leg lower has encompassed a nearly 12-to-1 down day, and a massive 19-to-1 down day, across a narrow three-session window. (Declining volume surpassed advancing volume by the stated margin. See Tuesday’s review for added context on the internals.)
Meanwhile, the CBOE Volatility Index (VIX) has still not registered a “higher high” even as the S&P 500 continues to notch material “lower lows.” (See this link, for the VIX’ backdrop.)
So collectively, the prevailing price action, the internals, and the sentiment backdrop signal an S&P 500 still vulnerable to longer-term downside. The quality of the next rally attempt may add color.
Watch List
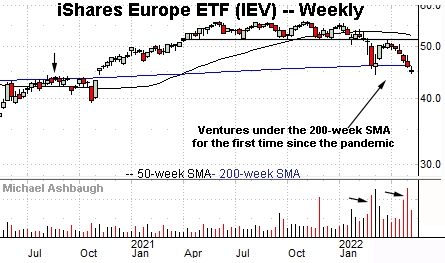
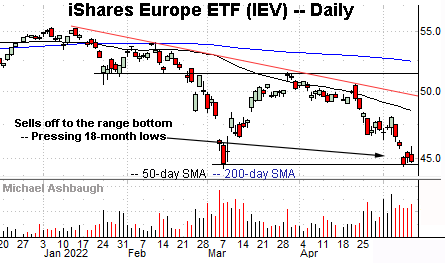
Drilling down further, the iShares Europe ETF (IEV) is tenuously positioned.
As illustrated, the shares have pulled in to the range bottom, pressing 18-month lows amid increased volume.
More broadly, the shares are vying to avoid the first weekly close under the 200-week moving average (46.14) since November 2020.
Recent retests of the 200-week moving average have been fueled by volume spikes — encompassing a lighter-volume rally attempt, capped by resistance — improving the chances of eventual downside follow-through. (See the weekly chart.)
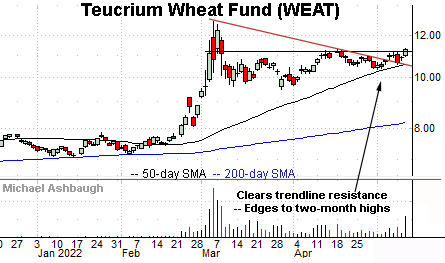
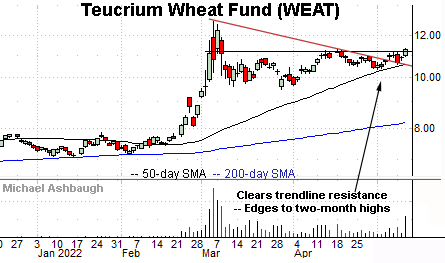
Moving to commodities, the Teucrium Wheat Fund (WEAT) — a fund consisting of wheat futures contracts — is showing signs of life.
Specifically, the shares have edged to two-month highs, amid a volume spike, opening the path to potentially decisive upside follow-through. (See the early-March spike.)
Tactically, a breakout attempt is in play barring a violation of the 50-day moving average, currently 10.60.
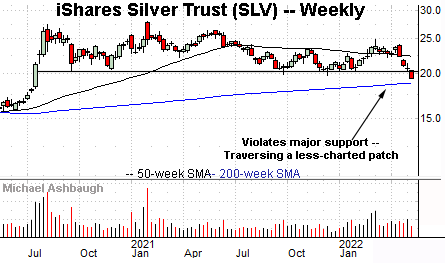
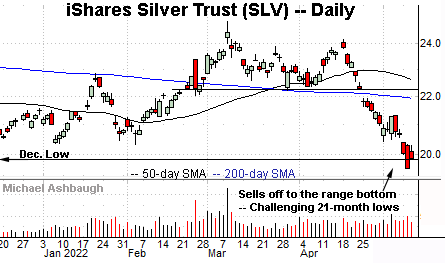
Conversely, the iShares Silver Trust (SLV) has turned lower, pulling in to a potentially important test.
Broadly speaking, the global-market downturn is translating to lower prices across asset classes. (Essential commodites, including crude oil, natural gas, wheat and corn have been an exception, a trend that’s likely to persist.)
As it applies to silver, the shares have ventured under major support, briefly tagging 21-month lows. Tactically, a swift reversal atop the former range bottom (20.40) would place the shares on firmer ground.
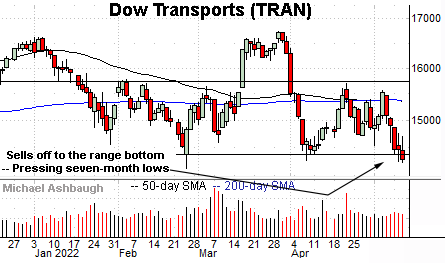
Looking elsewhere, the Dow Transports (TRAN) are challenging seven-month lows, pressured at least partly amid surging energy prices.
More broadly, the prevailing downturn places the 2021 low (13,946) within striking distance, a level matching major support. (See the five-year chart.) The pending retest of this area is a “watch out.”
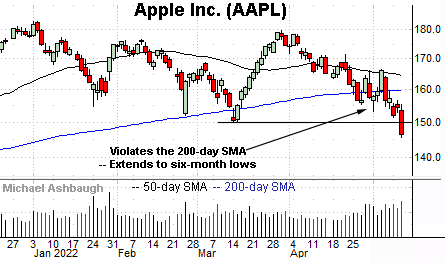
Finally, Dow 30 component Apple, Inc. (AAPL) has tagged new lows, pressured to punctuate a phase of relative strength versus its so-called FANG counterparts.
The prevailing downturn has been fueled by a sustained volume increase. Tactically, a swift reversal atop the breakout point (150.10) would place the brakes on bearish momentum.
More broadly, Apple has been overtaken by energy giant Saudi Aramco as the world’s largest company by market value. At least for now.

