Charting a successful technical test, S&P 500 spikes from major support (4,370)
Focus: Consumer staples sustain break to all-time highs, Caterpillar and Target stage breakout attempts, XLP, CAT, HPQ, TGT, STLD
Technically speaking, the U.S. benchmarks’ bigger-picture backdrop remains bearish, on balance, as the first-quarter earnings season unfolds.
Nonetheless, the S&P 500 and Nasdaq Composite have survived key technical tests — around S&P 4,370 and Nasdaq 13,350 — and the quality of their respective rally attempts will likely add color.
Editor’s Note: As always, updates can be directly accessed at https://chartingmarkets.substack.com.
Before detailing the U.S. markets’ wider view, the S&P 500’s hourly chart highlights the past four weeks.
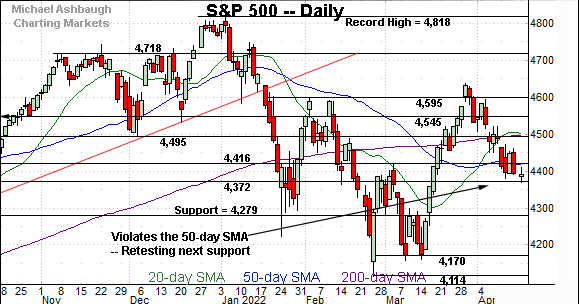
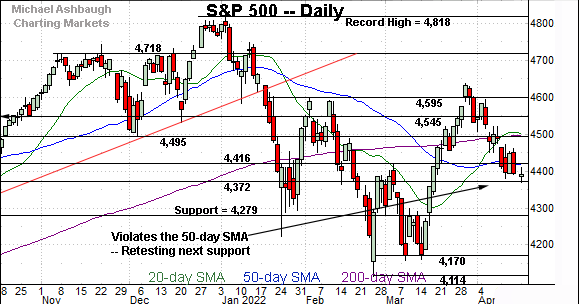
As illustrated, the S&P has apparently maintained major support (4,372) — an area detailed previously — and also illustrated on the daily chart.
The week-to-date low (4,370) has registered nearby to punctuate a successful retest.
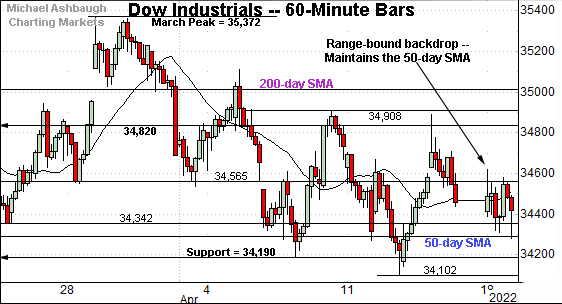
Meanwhile, the Dow Jones Industrial Average remains range-bound amid recently jagged price action.
Tactically, the index has asserted a posture atop its 50-day moving average, currently 34,294.
More broadly, major resistance (34,820) — detailed on the daily chart — is closely followed by the two-week range top (34,908).
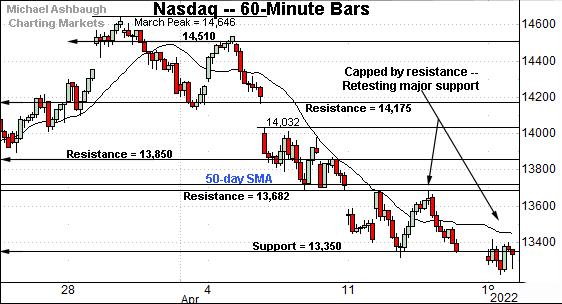
Against this backdrop, the Nasdaq Composite has asserted an April downtrend.
Tactically, the downturn has paused near major support (13,350), detailed previously.
Last week’s close (13,351) registered nearby.
Conversely, last week’s high (13,685) closely matched familiar resistance (13,682).
Widening the view to six months adds perspective.
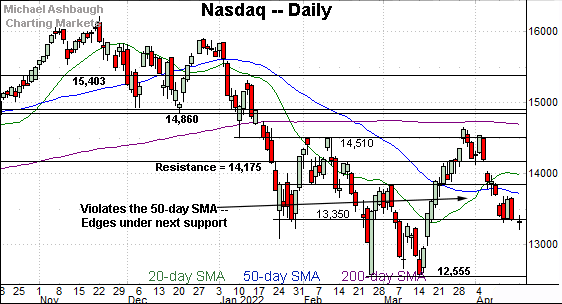
On this wider view, the Nasdaq seems to have weathered a shaky test of major support (13,350) with the benefit of Tuesday’s strong start.
From current levels, the 50-day moving average, currently 13,717, is followed by the former breakout point (13,850). Follow-through atop this area would signal waning bearish momentum. (Such a move would also raise the flag to a developing head-and-shoulders bottom.)
Still, based on today’s backdrop, the Nasdaq’s intermediate-term bias remains bearish-leaning.
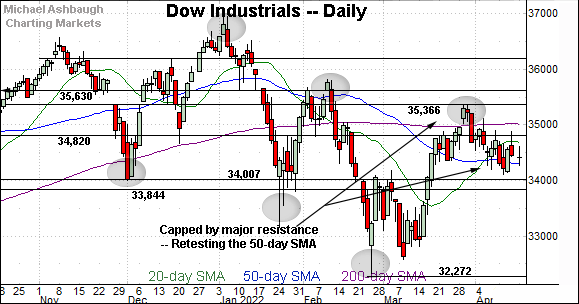
Looking elsewhere, the Dow Jones Industrial Average has staged a less aggressive April downturn.
In fact, this is the only major benchmark to largely sustain a posture atop its 50-day moving average.
Tactically, overhead inflection points match major resistance (34,820) and the 200-day moving average, currently 35,017.
Also recall the March peak (35,372) closely matched more distant overhead (35,366).
Meanwhile, the S&P 500 has maintained major support (4,372), an area detailed previously.
The April low (4,370) has registered nearby to punctuate a successful initial retest.
The bigger picture
As detailed above, the prevailing backdrop is not exactly one-size-fits-all — each benchmark is doing slightly different things — though the bigger-picture technicals, on balance, remain bearish.
Against this backdrop, the S&P 500 and Nasdaq Composite have nonetheless survived key tests — around S&P 4,370 and Nasdaq 13,350.
The quality of the prevailing rally attempt will likely add color.
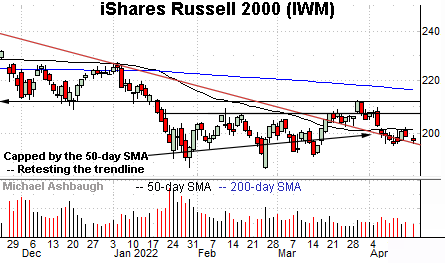
Moving to the small-caps, the iShares Russell 2000 ETF has pulled in to an extended test of trendline support. (The trendline is hinged to the November peak, not illustrated above.)
Tactically, the 50-day moving average, currently 201.64, is followed by the more distant range top (207.50). Follow-through atop these areas would mark progress.
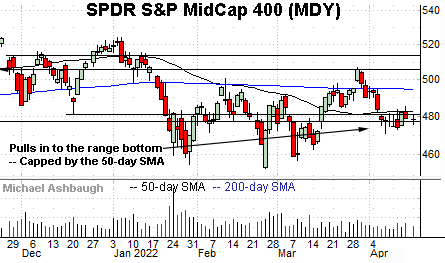
Meanwhile, the SPDR S&P MidCap 400 ETF has flatlined near major support (477.00).
Here again, the 50-day moving average, currently 482.68, marks an overhead inflection point.
Returning to the S&P 500, the index has maintained major support (4,372), an area detailed repeatedly.
The week-to-date low — also the April low (4,370) — has registered nearby. The quality of the rally from this area will likely add color.
When gauging the quality, familiar resistance (4,416) matches the 50-day moving average, also currently 4,416.
On further strength, more important resistance (4,495) closely matches the 200-day moving average, currently 4,496.
As always, it’s not just what the markets do, it’s how they do it. But generally speaking, the S&P 500’s prevailing backdrop supports a bearish-leaning intermediate- to longer-term bias pending sustained follow-through atop the 4,495 area.
More broadly, the S&P 500 and Nasdaq Composite have closely observed key technical levels — which is useful — though the absence of well-defined trends remains a challenge.
Watch List
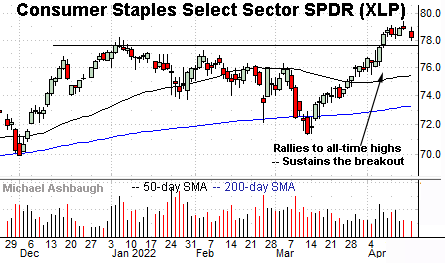
Drilling down further, the Consumer Staples Select Sector SPDR (XLP) is acting well technically. (Yield = 2.5%.)
The group started April with a strong-volume breakout, clearing resistance matching the January peak.
The subsequent flag pattern signals still muted selling pressure near record highs, improving the chances of upside follow-through. Tactically, the breakout point (77.60) is followed by the former range top (76.30) and the 50-day moving average.
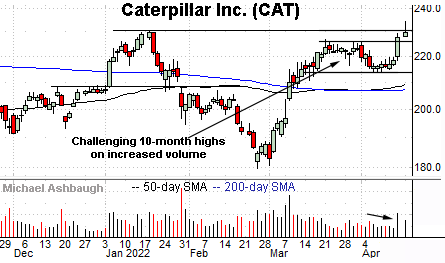
Moving to specific names, Caterpillar, Inc. (CAT) is a well positioned Dow 30 component. (Yield = 1.9%.)
As illustrated, the shares have rallied to the range top, rising to challenge 10-month highs.
The prevailing upturn punctuates an orderly one-month range — and has been fueled by increased volume — laying the groundwork for potential follow-through. Tactically, a breakout attempt is in play barring a violation of the former range top (225.90).
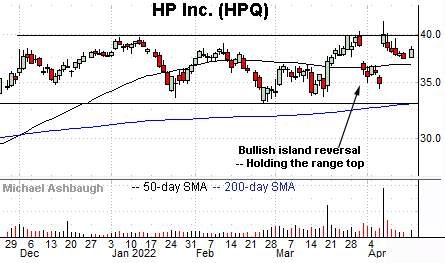
Elsewhere, HP, Inc. (HPQ) — the company formerly known as Hewlett-Packard — is setting up well technically. (Yield = 2.7%.)
Earlier this month, the shares knifed to the range top, briefly tagging record highs after Warren Buffett’s Berkshire Hathaway disclosed an 11% stake in the company.
The strong-volume spike punctuated a bullish island reversal, defined by the recent gaps. (The island reversal is generally a high-reliability reversal pattern.)
More broadly, the prevailing upturn punctuates a prolonged range — illustrated on the two-year chart — positioning the shares for potentially material upside follow-through. (The longer the base, the higher the space.)
Tactically, gap support (37.10) is closely followed by the 50-day moving average. The breakout attempt is intact barring a violation.
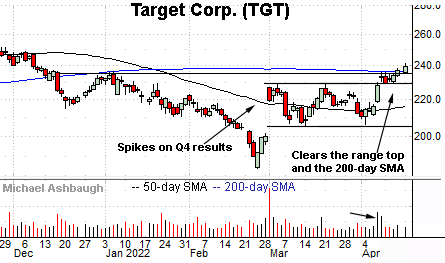
Target Corp. (TGT) is a large-cap retailer showing signs of life. (Yield = 1.5%.)
The shares initially spiked six weeks ago, gapping higher after the company’s strong quarterly results.
More immediately, the shares have tagged four-month highs, edging atop the 200-day moving average. The prevailing upturn punctuates a bull flag — (the tight one-week range) — hinged to a double bottom defined by the March and April lows.
Tactically, the 200-day moving average, currently 236.25, is followed by the former range top (228.50). A sustained posture higher signals a bullish bias.
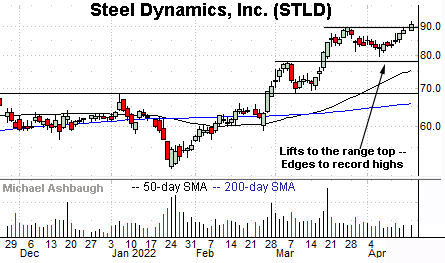
Finally, Steel Dynamics, Inc. (STLD) is a well positioned large-cap steel producer. (Yield = 1.5%.)
As illustrated, the shares have tagged record highs, eding atop resistance matching the March peak.
The prevailing upturn punctuates an orderly three-month range hinged to the steep mid-March strong-volume rally. Tactically, a near-term target projects to fractionally under the 100 mark on follow-through.
Note the company’s quarterly results are due out Wednesday, April 20.


