


Charting a slow-motion breakout attempt, S&P 500 edges to record highs
Focus: Nasdaq lifts within striking distance of record territory

Technically speaking, the major U.S. benchmarks are off to a jagged, but still largely bullish, 2025 start.
On a headline basis, the S&P 500 has rallied to record highs, while the Nasdaq Composite and Dow industrials have risen within striking distance of record territory. The charts below add color:
Editor’s Note: As always, updates can be directly accessed at chartingmarkets.substack.com.
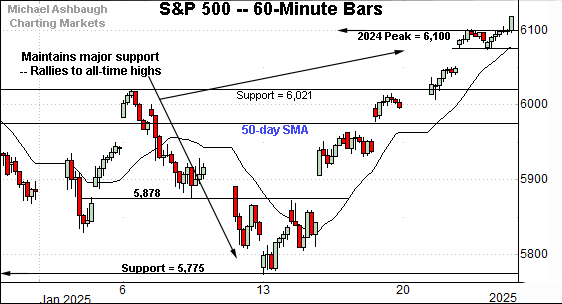
Before detailing the U.S. markets’ wider view, the S&P 500’s hourly chart highlights the past four weeks.
As illustrated, the S&P 500 has maintained major support (5,775) — an area detailed previously — and also illustrated on the daily chart.
More immediately, the relatively steep prevailing rally has been punctuated by a slight break to all-time highs. Tactically, the 6,100 mark pivots to support.
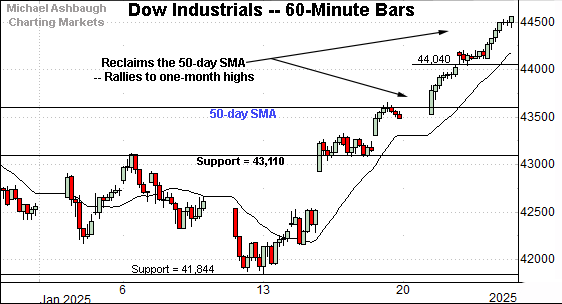
Meanwhile, the Dow Jones Industrial Average has rallied to one-month highs.
Tactically, the 44,040 area marks an inflection point, and is followed by the 50-day moving average, currently 43,610.
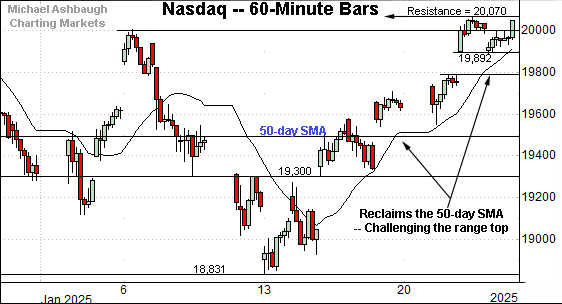
Against this backdrop, the Nasdaq Composite is challenging its one-month range top.
Tactically, resistance spans from the 20,000 mark to 20,070, areas detailed previously.
More broadly, the prevailing upturn places record territory within view, as illustrated below.
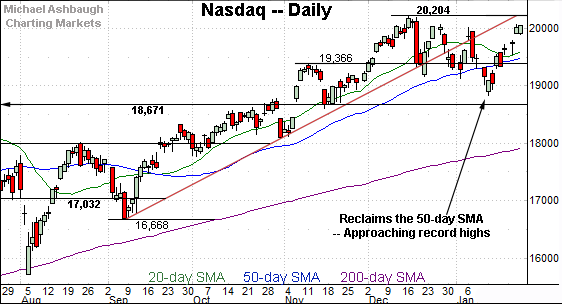
Widening the view to six months adds perspective.
On this wider view, the Nasdaq has whipsawed amid a jagged 2025 start.
The mid-January downdraft — and brief venture under the 50-day moving average — has been punctuated by a sharp reversal, placing the record high (20,204) within striking distance.
Slightly more broadly, notice the range top matches a trendline hinged to the September low. The Nasdaq violated its trendline to conclude December, and has since struggled to reclaim the trendline on a closing basis.
Against this backdrop, the November breakout point (18,671) remains a bull-bear fulcrum, an area the index has maintained since the U.S. election. The Nasdaq’s intermediate-term bias remains bullish barring a violation of this area.
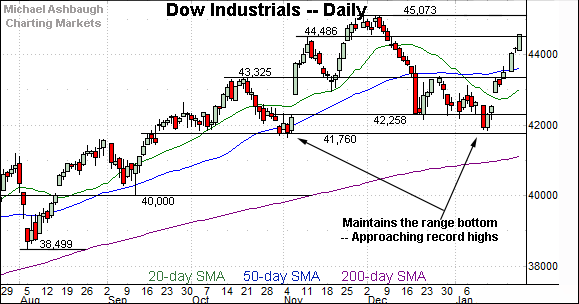
Looking elsewhere, the Dow Jones Industrial Average has knifed to one-month highs.
The prevailing upturn punctuates a one-month range previously capped by the 50-day moving average. Recall the Dow entered that range amid a 10-session December losing streak, the Dow’s longest stretch in 50 years.
Also notice that trends have accelerated amid recent breaks from the 50-day moving average — in both directions.

Meanwhile, the S&P 500 has spiked to a nominal record high.
The prevailing upturn originates from major support (5,775) a bull-bear fulcrum detailed previously. (See the Jan. 8 review.)
The January low (5,773) registered nearby.
The bigger picture
As detailed above, the major U.S. benchmarks are off to a jagged, but still largely bullish, 2025 start.
On a headline basis, the S&P 500 has rallied to record highs, while the Nasdaq Composite and Dow industrials have risen within striking distance of record territory.
As always, the S&P 500 — comprised of 500 companies — is the most representative of the widely-tracked U.S. benchmarks.
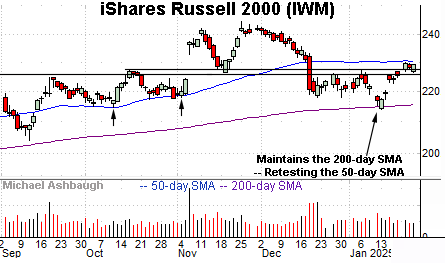
Moving to the small-caps, the iShares Russell 2000 ETF (IWM) has asserted a holding pattern.
As illustrated, the small-cap benchmark has recently maintained its 200-day moving average, a widely-tracked longer-term trending indicator.
More immediately, a retest of the 50-day moving average — an intermediate-term trending indicator — remains underway. Recall the 50-day moving average previously underpinned the late-2024 price action. (See the Oct. and Nov. lows.)

Meanwhile, the SPDR S&P MidCap 400 ETF (MDY) has strengthened slightly versus the small-caps.
Here again, the group has maintained its 200-day moving average at the January low, preserving its longer-term uptrend.
The subsequent rally places the mid-caps back atop the breakdown point, circa 581, and the 50-day moving average, currently 591.50. A sustained posture atop these areas signals a bullish intermediate-term bias.
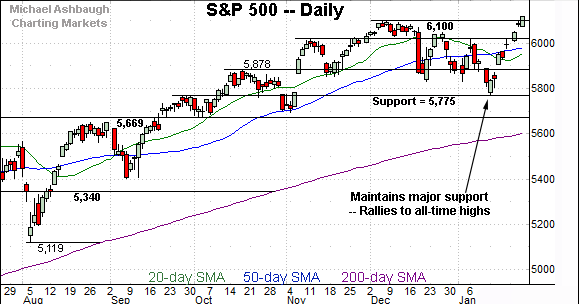
Returning to the S&P 500, the index is acting well technically.
As illustrated, the S&P has effectively nailed major support (5,775) an area defining “last-ditch support” for market bulls. (See the Jan. 8 review.)
Recall this area (5,775) goes back to early November, matching twin gaps established immediately before the U.S. election.
The prevailing rally from support has been steep, and punctuated by a modest break to record territory.
Slightly more broadly, the prevailing upturn punctuates a nearly three-month range hinged to the early-November rally. An intermediate-term target projects from the range to 6,425.
Against this backdrop, the 6,100 mark pivots to initial support. This is followed by the 50-day moving average, and a familiar floor in the 5,872-to-5,878 area.
Delving deeper, last-ditch support continues to match the pre-election gap 5,775.
As always, it’s not just what the markets do, it’s how they do it.
But generally speaking, the S&P 500’s intermediate-term bias remains bullish barring a violation of the 5,775 area. Next week’s close is also a monthly close and will likely add color.
Also see Jan. 8: Charting market cross currents, U.S. benchmarks register jagged 2025 start.