Charting a double top, S&P 500 challenges major support (4,430)
Focus: Gold tags major resistance, Metals & mining sector takes flight, Airlines venture atop 200-day average, GLD, XME, JETS, CNX, SBLK
Technically speaking, the major U.S. benchmarks are once again on the defensive mid-week, pressured amid persistently increased volatility.
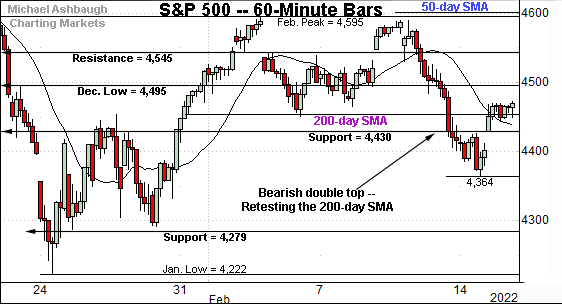
Against this backdrop, the S&P 500 is back for its latest crack at major support (4,430), an area roughly matching the marquee 200-day moving average. A potentially consequential retest remains underway.
Editor’s Note: As always, updates can be directly accessed at https://chartingmarkets.substack.com.
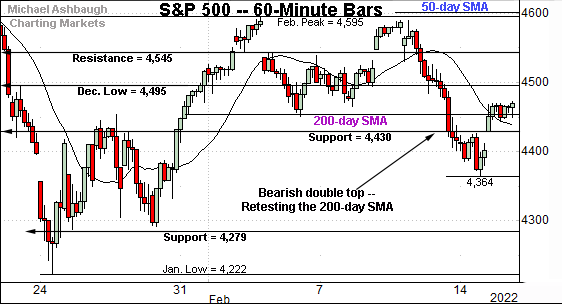
Before detailing the U.S. markets’ wider view, the S&P 500’s hourly chart highlights the past four weeks.
As illustrated, the S&P has pulled in from its range top, punctuating a double top defined by the February peaks.
Separately, recall that a key bull-bear inflection point — detailed last week — broadly spans from 4,430 to the 200-day moving average, currently 4,456.
Tuesday’s session low (4,429) and Wednesday’s early session low (4,433) have closely matched the inflection point.
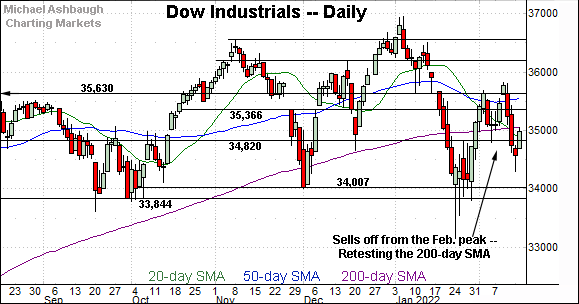
Similarly, the Dow Jones Industrial Average has reached a headline technical test.
Here again, the specific level matches the 200-day moving average, currently 35,051.
The week-to-date peak (35,048) has registered just under the 200-day, an area that has thus far capped the index.
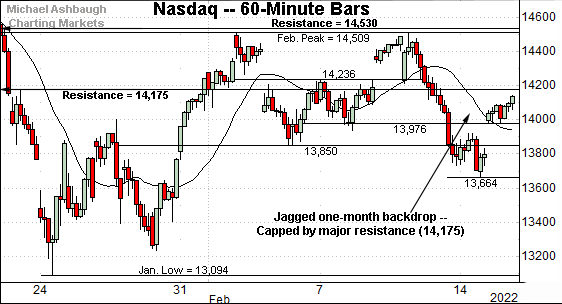
Against this backdrop, the Nasdaq Composite has also whipsawed amid increased volatility.
Like the other benchmarks, its mid-February downdraft punctuated a double top, defined by the February peaks.
The subsequent rally attempt has been capped by major resistance (14,175), an area better illustrated below.
Widening the view to six months adds perspective.
On this wider view, the Nasdaq has whipsawed amid jagged February price action.
Consecutive failed tests of major resistance (14,530) have been punctuated by sharp pullbacks. (Also see the hourly chart.)
More broadly, notice the pending death cross — or bearish 50-day/200-day moving average crossover — an event that will likely signal this week. Though frequently a lagging indicator, the crossover signals that the bearish intermediate-term trend has overtaken the primary trend.
Tactically, the Nasdaq’s bigger-picture backdrop remains bearish pending follow-through atop resistance (14,530) and the major moving averages.
Looking elsewhere, the Dow Jones Industrial Average continues to whipsaw amid an increasingly bearish backdrop.
Tactically, its initial rally from the February low has been capped by the 200-day moving average, currently 35,051.
Tuesday’s session high (35,048) — also the week-to-date peak — has effectively matched the 200-day amid a failed retest from underneath.
More broadly, notice the developing head-and-shoulders top defined by the November, January and February peaks. A violation of the 34,000 area would resolve the bearish pattern, opening the path to potentially swift downside follow-through.
Separately, the index has struggled to stabilize since the late-November downdraft, a move initially fueled by omicron’s emergence, and nearly immediately followed by the Federal Reserve’s hawkish-leaning policy tilt.
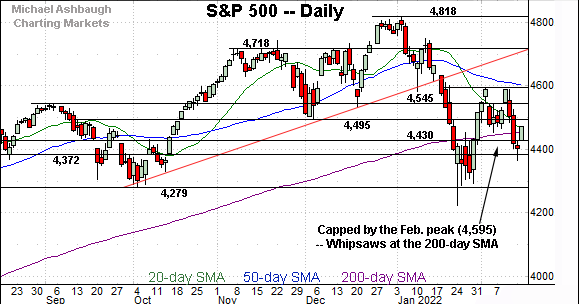
Meanwhile, the S&P 500 has also whipsawed amid shaky February price action.
Tactically, a key bull-bear inflection point — detailed last week — broadly spans from 4,430 to the 200-day moving average, currently 4,456.
To reiterate, Tuesday’s session low (4,429) and Wednesday’s early session low (4,433) have closely matched the inflection point. A potentially consequential retest remains underway.
The bigger picture
Though prevailing backdrop is not one-size-fits-all — (the S&P 500 is very slightly outperforming) — the bigger-picture technicals are increasingly bearish.
On a headline basis, the S&P 500 and Dow industrials have re-violated the 200-day moving average, and are subsequently struggling to reassert a posture higher.
Meanwhile, the Nasdaq Composite has re-violated major resistance (14,175), notching three consecutive closes lower.
Each benchmark’s mid-month downdraft resolved a double top — illustrated on the hourly charts — and has been punctuated by a comparably lackluster rally attempt, capped by key resistance. Shaky price action.
Moving to the small-caps, the iShares Russell 2000 ETF continues to lag behind the major U.S. benchmarks.
Recall the January downdraft punctuated a head-and-shoulders top defined by the September, November and January peaks.
More immediately, the prevailing rally attempt has been fueled by decreased volume — versus the November and January downdrafts — and thus far effectively capped by the neckline.
More distant overhead broadly spans from 208.75 to 211.10, an area matching the 50-day moving average. Follow-through atop this area would mark technical progress.
Meanwhile, the SPDR S&P MidCap 400 ETF remains comparably stronger than the Russell 2000.
Still, the MDY has whipsawed of late between two key technical areas.
To start, the February peak has closely matched the cross section of its 50- and 200-day moving averages.
Conversely, the MDY has stablized atop its former breakdown point (477.50), an area detailed repeatedly.
Tuesday’s session low (477.59) matched support.
Tactically, upside follow-through atop the major moving averages — the 497.20 area — would strengthen the bull case.
Placing a finer point on the S&P 500, the index has reached a notable technical test.
To reiterate, a key bull-bear inflection point — detailed last week — broadly spans from 4,430 to the 200-day moving average, currently 4,456.
More broadly, the S&P 500’s latest downdraft — its second failed test of the February peak — has been directionally aggressive.
The index knifed straight through several major support points — at 4,545, the 4,495 mark and 4,430 — as well as the 200-day moving average.
More plainly, these well-defined areas “should have” drawn buyers if a viable recovery attempt were in play.
But against this backdrop, the S&P 500 has thus far narrowly maintained last-ditch support, most recently detailed Friday.
The specific area spans from 4,430 to the 200-day moving average, currently 4,456.
To reiterate, the week-to-date low low (4,429) and Wednesday’s early session low (4,433) have effectively matched major support.
So collectively, a potentially consequential test of the 4,430 area remains underway amid an otherwise shaky technical backdrop.
Based on today’s backdrop, the S&P 500’s longer-term bias remains guardedly bullish-leaning barring a violation of the 4,430-to-4,455 area. The next several sessions will likely add color ahead of an extended three-day weekend for the U.S.
Watch List
Drilling down futher, the SPDR Gold Shares ETF has come to life, rising amid a safe-haven trade, fueled at least partly by geopolitical tensions.
In the process, the shares have briefly tagged eight-month highs.
Tactically, an inflection point matches the November gaps, circa 172.10, levels formerly defining a bearish island reversal. The prevailing breakout attempt is intact barring a violation.
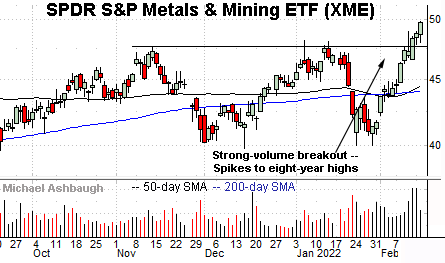
Meanwhile, the SPDR S&P Metals & Mining ETF has broken out, reaching eight-year highs amid a sustained volume increase.
The prevailing upturn punctuates a double bottom defined by the November and January lows.
Tactically, the breakout point (47.70) pivots to support. A sustained posture higher signals a bullish bias.
Elsewhere, the U.S. Global Jets ETF is showing signs of life technically.
Earlier this month, the group knifed to two-month highs, rising amid optimism over easing virus restrictions.
This week’s follow-through places the group slightly atop the 200-day moving average, currently 23.30.
Tactically, gap support (22.50) matches the former range top. A breakout attempt is in play barring a violation.
Moving to specific names, CNX Resources Corp. is a well positioned mid-cap oil and gas name.
Technically, the shares have tagged three-year highs, rising from a cup-and-handle defined by the December and late-January lows.
The prevailing upturn punctuates a successful test of the 50-day moving average. An intermediate-term target projects to the 18.70 area on follow-through.
Conversely, the breakout point (16.20) pivots to well-defined support.
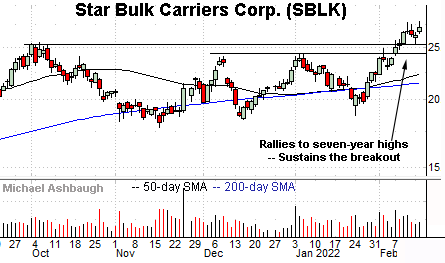
Finally, Star Bulk Carriers Corp. is a mid-cap Greece-based dry bulk shipping name.
Earlier this month, the shares knifed to seven-year highs, clearing a well-defined range top.
The subsequent flag pattern has been underpinned by the breakout point (25.25) positioning the shares to build on the steep rally from the January low.
More broadly, the shares are well positioned on the five-year chart, rising from a prolonged continuation pattern hinged to the steep early-2021 rally.


