Charting a bullish reversal, S&P 500 spikes amid stealth quarter-point rate cut
Focus: Market sentiment backdrop improves as measured by Volatility Index
Technically speaking, the major U.S. benchmarks have knifed from multi-month lows, rising as 2022 volatility persists.
Against this backdrop, a potentially viable rally attempt is in play, though sustainability and upside follow-through remain an open question, ahead of Friday’s weekly close and Monday’s monthly close.
Editor’s Note: As always, updates can be directly accessed at https://chartingmarkets.substack.com.
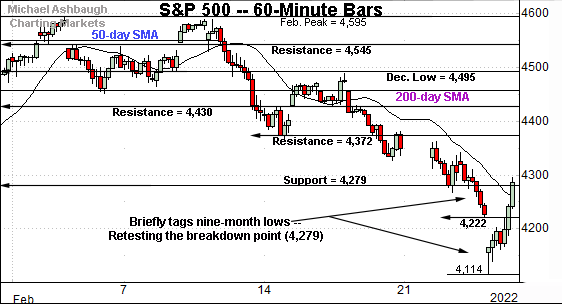
Before detailing the U.S. markets’ wider view, the S&P 500’s hourly chart highlights the past four weeks.
As illustrated, the S&P has whipsawed at major support (4,279).
The index briefly tagged nine-month lows Thursday, before staging a massive 174-point, or 4.2%, intraday reversal.
The session close (4,288) narrowly registered atop major support (4,279).
From current levels, the January low (4,222) marks a notable floor, a level also matching Wednesday’s session low (4,221.5).
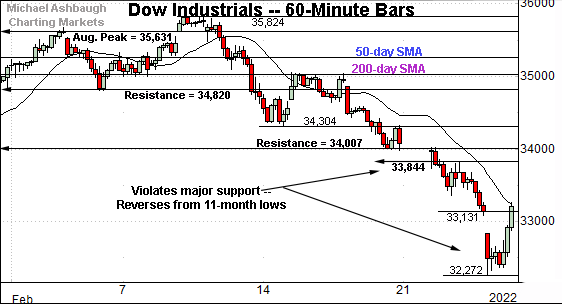
Similarly, the Dow Jones Industrial Average is rising from multi-month lows.
In its case, the index briefly tagged 11-month lows Thursday, before staging a 951- point, or 2.9%, intraday reversal.
From current levels, a near-term floor rests in the 33,130-to-33,150 area, levels matching Wednesday’s close (33,131) and the January low (33,150) respectively.
Slightly more broadly, the index is traversing a less-charted patch capped by major resistance — the 34,844 and 34,000 areas — also detailed on the daily chart.
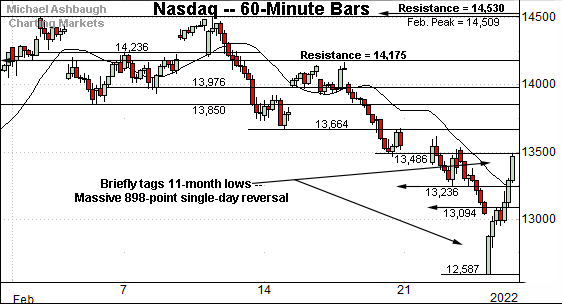
Against this backdrop, the Nasdaq Composite has staged a massive single-day reversal.
From top to bottom, the index spiked 898 points, or 7.1% intraday, after briefly tagging 11-month lows.
This marks its largest single-day bullish reversal since March 2020, as the pandemic was taking hold. (The March 2020 spike was followed by incremental downside before the Nasdaq established its ultimate low.)
Tactically, downside inflection points match the January lows — around 13,236 and 13,094 — levels that have also been observed this week.
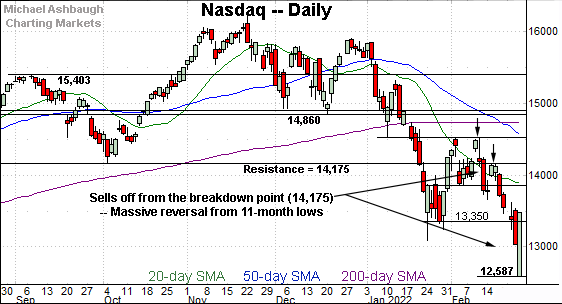
Widening the view to six months adds perspective.
On this wider view, the Nasdaq has staged a bullish reversal from 11-month lows. A near-term recovery attempt is in play.
Tactically, the January closing low (13,350) offers an area to work against.
Friday’s early session low (13,358) registered nearby.
Conversely, the 13,850 area marks the mid-month breakdown point, also detailed on the hourly chart. The pending retest from underneath should be a usefull bull-bear gauge.
More broadly, the Nasdaq’s intermediate- to longer-term bias remains bearish pending follow-through atop resistance (14,530) and the major moving averages.
Looking elsewhere, the Dow Jones Industrial Average has whipsawed amid a technical breakdown.
Recall the prevailing downturn punctuates a head-and-shoulders top, defined by the November, January and February peaks.
Tactically, major resistance (33,844) remains an overhead inflection point, detailed previously.
(Wednesday’s session high (33,832) and Friday’s early session high (33,853) registered within 12 points of resistance.)
On further strength, the Dow’s breakdown point, circa 34,000, remains slightly more distant. The pending retest of this area is worth tracking.
A monthly close atop the 34,000 area would strengthen the Dow industrials’ backdrop.
Meanwhile, the S&P 500 remains the strongest major benchmark, though “strongest” is a relative term.
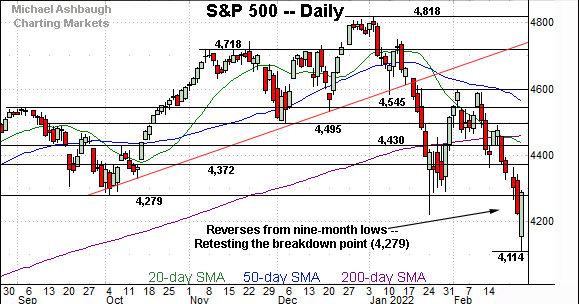
Tactically, the index seems to have weathered a fleeting whipsaw under the range bottom, an area defined by the October low (4,279).
Thurday’s close (4,288) registered narrowly atop support, and the S&P has followed through higher early Friday.
More broadly, the S&P 500 is rising from its first 10% correction in almost exactly two years.
The bigger picture
As detailed above, the major U.S. benchmarks have reversed respectably from multi-month lows.
Against this backdrop, a potentially viable near-term rally attempt is underway within the context of a still bearish intermediate- to longer-term backdrop.
Why the massive bullish reversal? Three developments stand out:
To start, the major benchmarks were deeply oversold. At Thursday’s session low, the Nasdaq Composite had dropped as much as 22.4% from its record high, while the S&P 500 had dropped as much as 14.6% from its corresponding record.
Second, the contours of the U.S. response to the Ukraine situation — as outlined by the administration Thursday — have been less-onerous-than-feared.
But perhaps most importantly, at least from the markets’ standpoint, the prevailing backdrop is believed to lay the groundwork for a less-hawkish Federal Reserve. Before Thursday, the market expected a half-point interest rate hike at the Fed’s March meeting. After Thursday’s opening downdraft, a less aggressive quarter-point rate hike had been priced in.
So in a sense, the markets are spiking amid what amounts to a quarter-point interest rate cut versus previous expectations. Time will tell whether the prevailing market expectations prove to be accurate.
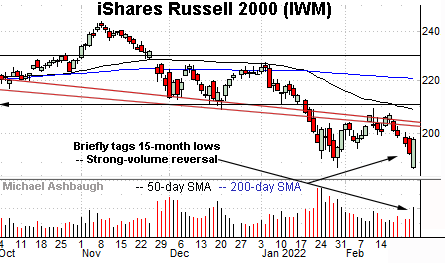
Moving to the small-caps, the iShares Russell 2000 ETF has staged a strong-volume reversal after briefly tagging 15-month lows.
Tactically, initial resistance, circa 204.00, is followed by the breakdown point, an area broadly spanning from 208.75 to 211.10. Follow-through atop these areas would mark technical progress.
Meanwhile, the SPDR S&P MidCap 400 ETF has reversed from 11-month lows.
Tactically, overhead inflection points match the breakdown point (477.50) and the December low (481.48).
Moving to market sentiment, the Volatility Index (VIX) — a widely-tracked market-fear gauge, detailed Wednesday — has taken a more constructive turn.
As always, extreme VIX highs signal excessive fear, consistent with durable S&P 500 lows.
Conversely, extreme VIX lows signal investor complacency, consistent with S&P 500 tops.
Against the current backdrop, the Volatility Index registered a 15-month open/close high Thursday, its highest opening or closing level since Nov. 2020, just before the U.S. election.
At the same time, the S&P 500 has registered an eight-month closing low this week. (As well as a nine-month open/close low Thursday.)
Though not dispositive, the prevailing sentiment backdrop is now more consistent with a durable S&P 500 low (or at least a trading low) than it had been mid-week.
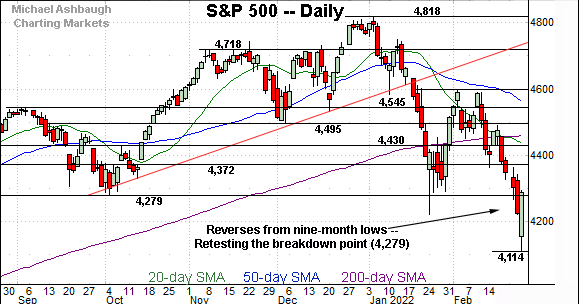
Returning to the S&P 500’s daily chart, the index has whipsawed at major support (4,279).
To reiterate, Thursday’s close (4,288) registered narrowly atop support to punctuate a wide-ranging 174-point (4.2%) single-day reversal.
More immediately, Friday’s early follow-through builds on the bullish reversal.
Tactically, the S&P 500’s near-term recovery attempt is intact barring a violation of the January low (4,222) a level also matching Wednesday’s session low (4,221.5). (See the hourly chart.)
Beyond near-term bounces, the S&P 500’s more important intermediate- to longer-term bias remains bearish pending extensive repairs. Follow-through atop the 4,430 resistance, and the the 200-day moving average, would be cause to reassess the longer-term bias.
Amid the cross currents, Friday’s weekly close, and Monday’s monthly close, will likely add color.


