Charting a bullish reversal, S&P 500 extends rally from the May low
Focus: Small- and mid-caps register bullish divergence amid rally attempt
Technically speaking, the major U.S. benchmarks are back on the offensive, for the near-term, rising after a rare batch of upwardly-revised corporate profit forecasts — from Macy’s, Dollar Tree and Dollar General.
Against this backdrop, the S&P 500 has extended a respectable rally from the May low, though sustainability and follow-through from current levels remain open questions.
Editor’s Note: As always, updates can be directly accessed at https://chartingmarkets.substack.com.
Before detailing the U.S. markets’ wider view, the S&P 500’s hourly chart highlights the past four weeks.
As illustrated, the S&P has extended a reversal from the May low.
Tactically, overhead inflection points — around 4,062 and 4,090 — are followed by major resistance (4,170) also detailed on the daily chart.
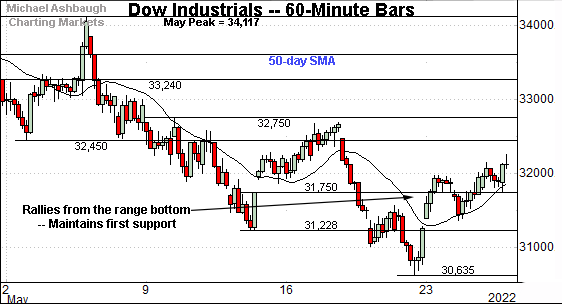
Similarly, the Dow Jones Industrial Average has extended a bullish reversal.
Amid the upturn, Wednesday’s session low (31,754) closely matched first support (31,750). Constructive price action.
On further strength, the 32,450 area is followed by the three-week range top (32,752).
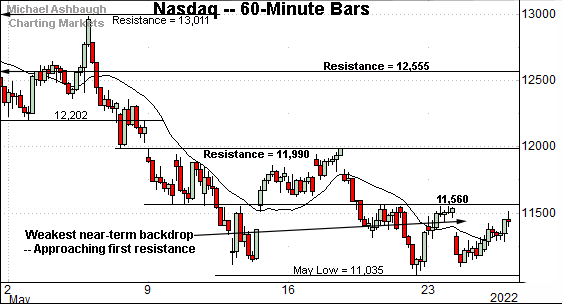
True to recent form, the Nasdaq Composite remains the weakest major benchmark.
But on the positive side, the index has registered more technical price action of late than the other benchmarks.
Tactically, the 11,560 area is followed by the 11,990 resistance.
Recall last week’s high (11,988) effectively matched resistance.
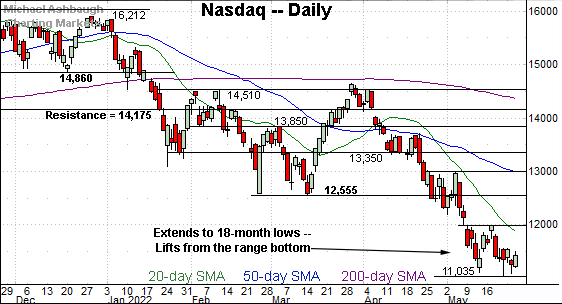
Widening the view to six months adds perspective.
On this wider view, the Nasdaq remains range-bound.
The prevailing range spans nearly 1,000 points, roughly from the 11,000 mark to the 12,000 mark. (More precisely, the nearly three-week range spans 953 points, or 8.6%.)
Tactically, follow-through atop the 11,990 resistance — and the more distant breakdown point (12,555) — would mark technical progress.
Looking elsewhere, the Dow Jones Industrial Average has reversed more aggressively from the May low. (The Nasdaq Composite has rallied nowhere near the February low.)
As illustrated, last week’s bull hammer — at the May low — has been punctuated by upside follow-through, and three straight closes near session highs.
More broadly, the Dow’s technical levels have been less well-defined amid the May whipsaws. Tactically, the 32,270 area is followed by firmer overhead around 32,630.
Meanwhile, the S&P 500 has asserted at least a near-term floor slightly above the 3,800 mark.
On further strength, the mid-May peak (4,090) is followed by the much firmer breakdown point (4,170).
The bigger picture
As detailed above, the major U.S. benchmarks have reversed from the May low.
Though the initial lift registered mixed marks for style, at best, the rally attempt has accelerated early Thursday. The weekly close, and Tuesday’s monthly close, will likely add color.
Moving to the small-caps, the iShares Russell 2000 ETF (IWM) continues to tread water.
Tactically, initial resistance, circa182.60, is followed by the firmer breakdown point (188.00). Follow-through atop these areas would signal waning bearish momentum.
Similarly, the SPDR S&P MidCap 400 ETF (MDY) is digesting a May downdraft.
Tactically, the breakdown point (452.90) — detailed previously — is followed by the post-breakdown closing peak (454.00).
More broadly, the small- and mid-cap benchmarks did not register new lows last week, exhibiting strength versus the big three U.S. benchmarks.
Returning to the S&P 500, this next chart is a weekly view, spanning 30 months. Each bar on the chart represents one week.
As detailed previously, the May downdraft has opened the path to a downside target in the 3,800 area. The May low (3,810) — established last week — registered nearby.
The index has since rallied respectably.
Tactically, the April close (4,131) closely matched trendline resistance, and is followed by the breakdown point (4,170).
So the 4,130-to-4,170 area broadly marks major resistance. Follow-through atop this area would mark notable progress.
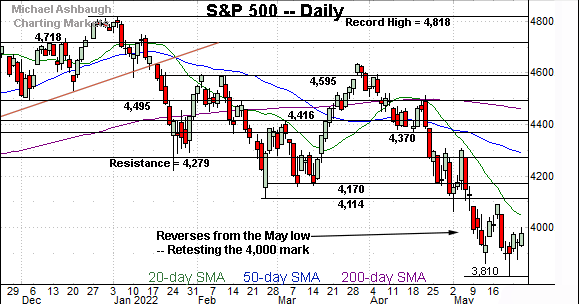
Returning to the six-month view, the S&P 500 is trending lower, though amid jagged price action.
Tactically, the mid-May peak (4,090) is followed by an inflection point matching the February low (4,114).
On further strength, significant resistance matches the breakdown point (4,170). Recall the steep late-March rally originated from the 4,170 mark.
Beyond technical levels, market sentiment — as measured by the CBOE Volatility Index (VIX) — is still not ideally structured to signal the S&P 500 has established the low.
Nonetheless, price action trumps other indicators, and the quality of the prevailing rally attempt should add color.
Based on today’s backdrop, the S&P 500’s latest corrective bounce is underway amid a still bearish bigger-picture backdrop. Eventual follow-through atop the 4,170 area would raise the flag to a potentially more legitimate rally attempt. No new setups today.


