Charting a bull-trend pullback, S&P 500 retests first support
Focus: Amazon.com ventures under 200-day moving average, AMZN, CRM, AMD, FTNT, SYNA
U.S. stocks are lower early Monday, pressured amid geopolitical tensions, and concerns over potentially slowing global growth.
Against this backdrop, the S&P 500 and Dow Jones Industrial Average have pulled in modestly from their latest record highs, while the Nasdaq Composite continues to lag slightly behind.
Editor’s Note: As always, updates can be directly accessed at chartingmarkets.substack.com.
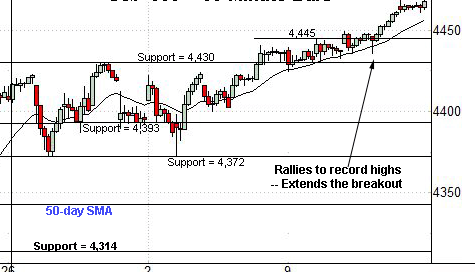
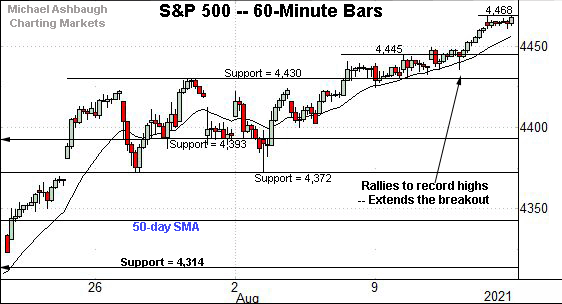
Before detailing the U.S. markets’ wider view, the S&P 500’s hourly chart highlights the past four weeks.
As illustrated, the S&P concluded last week with slow-motion follow-through to record highs.
Tactically, near-term support, circa 4,445, is followed by the former range top (4,430).
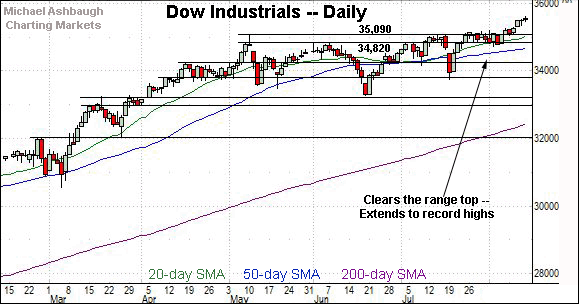
Similarly, the Dow Jones Industrial Average has extended an August break to record territory.
Tactically, a familiar inflection point — the 35,285-to-35,300 area — matches last week’s gap.
Delving deeper, the former range top (35,192) is followed by the May peak (35,091).
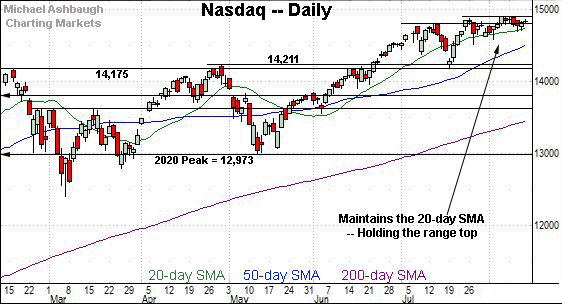
Against this backdrop, the Nasdaq Composite continues to lag slightly behind. The index did not tag record highs last week, unlike the other benchmarks.
Nonetheless, the Nasdaq has thus far managed to hold its range top.
Tactically, Monday’s early session low (14,610) has registered near familiar support (14,615).
Delving deeper, the 50-day moving average, currently 14,506, effectively matches the prevailing range bottom.
Widening the view to six months adds perspective.
On this wider view, the Nasdaq has asserted a tight August range, underpinned by the 20-day moving average, currently 14,751. The index has ventured under its 20-day moving average early Monday.
Delving deeper, the 50-day moving average, currently 14,506, is followed by likely last-ditch support broadly spanning from 14,175 to 14,211.
Recall the July low (14,178) closely matched major support.
Tactically, an eventual violation of this area would mark a material “lower low” — combined with a violation of the 50-day moving average — raising a technical caution flag.
Looking elsewhere, the Dow Jones Industrial Average has broken out as the Nasdaq Composite pulls in modestly.
The prevailing follow-through punctuates an inverse head-and-shoulders pattern — defined by the May, June and July lows — and confirms the primary uptrend.
Tactically, the Dow’s first notable floor closely matches the May peak (35,091), an area detailed repeatedly.
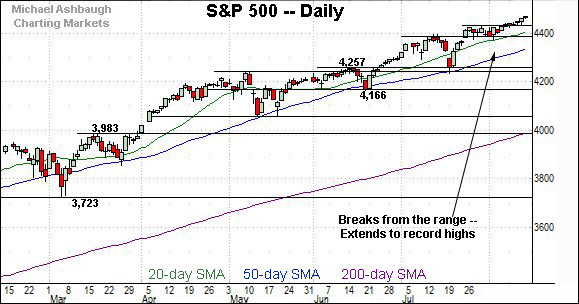
Meanwhile, the S&P 500 has also tagged a nominal record high.
The August follow-through punctuates a flag pattern — the tight two-week range — underpinned by the former breakout point (4,393).
The bigger picture
Collectively, the major U.S. benchmarks are acting well technically, on balance, Monday’s early downturn notwithstanding.
On a headline basis, the S&P 500 and Dow industrials tagged record highs last week — in slow-motion form — while the Nasdaq Composite continues to lag slightly behind.
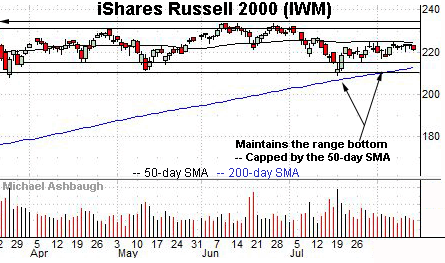
Moving to the small-caps, the iShares Russell 2000 ETF remains remarkably range-bound.
Within the range, the flatlining 50-day moving average, currently 224.42, remains an inflection point.
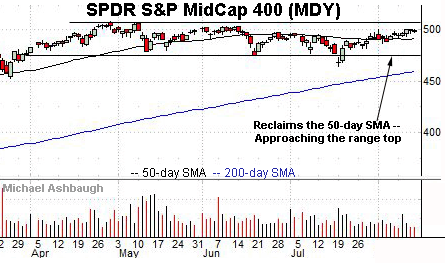
Meanwhile, the SPDR S&P MidCap 400 ETF has strengthened slightly in recent weeks versus the small-caps.
The modest August upturn places record territory within striking distance.
Placing a finer point on the S&P 500, the index has trended steadily higher, maintaining a posture atop the 20-hour moving average.
Tactically, the breakout point (4,430) marks the S&P’s first notable floor.
On further weakness, the August low (4,373) closely matches the former range bottom (4,372).
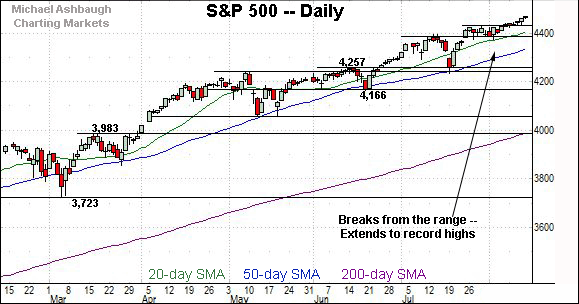
More broadly, the ascending 50-day moving average, currently 4,336, marks an inflection point.
The S&P has largely trended atop the 50-day moving average since November.
In fact, the index has not registered consecutive closes under the 50-day moving average going back to late October.
Prior retests of the 50-day have marked intermediate-term lows, punctuated by a resumption of the uptrend.
Delving deeper, likely last ditch-support matches the June breakout point (4,257). The July closing low (4,258) effectively matched support.
Tactically, an eventual violation of the 4,257 area would mark a material “lower low” likely raising a caution flag. The S&P 500’s intermediate-term bias remains bullish barring a violation of this area.
Editor’s note: The next review will be published Wednesday.
Watch List
Drilling down further, Amazon.com has reached a potentially consequential technical test.
Late last month, the shares gapped sharply lower, pressured after the company’s second-quarter results and tepid guidance.
The subsequent rally attempt has been flat, and punctuated by downside follow-through to the 200-day moving average, currently 3,273.70.
As always, the 200-day moving average is a widely-tracked longer-term trending indicator.
Last week’s close (3,293.97) registered slightly atop the 200-day, though the shares have ventured lower early Monday. A closing violation would raise the flag to a potential primary trend shift.
On further weakness, deeper inflection points — at 3,127 and 3,172 — closely match the May and June lows. Follow-through under this area would mark a material “lower low” strengthening the bear case.
Conversely, the August peak (3,391) matches a breakdown point, of sorts. A rally atop this area would mark a step toward stabilization.
Salesforce.com, Inc. is a well positioned large-cap name.
Technically, the shares have rallied to the range top, rising to challenge eight-month highs.
The prevailing upturn punctuates a tight August range, effectively underpinned by the 50-day moving average. (See the July and August lows.)
Tactically, a breakout attempt is intact barring a violation of near-term support, circa 242.00. Conversely, an intermediate-term target projects to the 270 area on follow-through.
Note the company’s quarterly results are due out Aug. 25.
Advanced Micro Devices, Inc. is a well positioned large-cap semiconductor name.
Late last month, the shares knifed to record highs, rising after the company’s strong quarterly results. (The subsequent upside follow-through registered after the company unveiled a new product line, including a graphics chip to be available in Apple’s Mac Pro desktops.)
More immediately, the prevailing pullback has been fueled by decreased volume, placing the shares 10.8% under the August peak.
Tactically, near-term support (106.50) is followed by the post-breakout low (104.36). A sustained posture higher signals a firmly-bullish bias.
Synaptics, Inc. is a large-cap producer of touch-interface solutions including touchpads.
Earlier this month, the shares gapped to record highs, rising after the company’s quarterly results.
The subsequent flag pattern has formed amid decreased volume, positioning the shares to build on the initial spike.
Tactically, the post-breakout low (166.05) is followed by the top of the gap (158.00) a level closely matching the breakout point. The prevailing rally attempt is intact barring a violation.
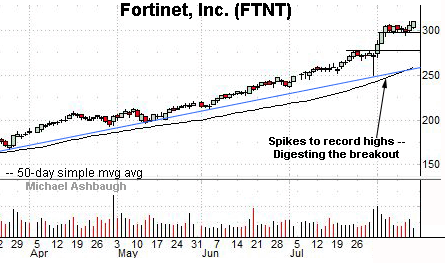
Finally, Fortinet, Inc is a well positioned large-cap cybersecurity name.
The shares started August with a strong-volume breakout, rising after the company’s second-quarter results.
The subsequent flag-like pattern positions the shares to extend the uptrend. Tactically, near-term support (298.70) is closely followed by the post-breakout low (293.70).
Delving deeper, trendline support roughly tracks the 50-day moving average.
Editor’s note: The next review will be published Wednesday.

